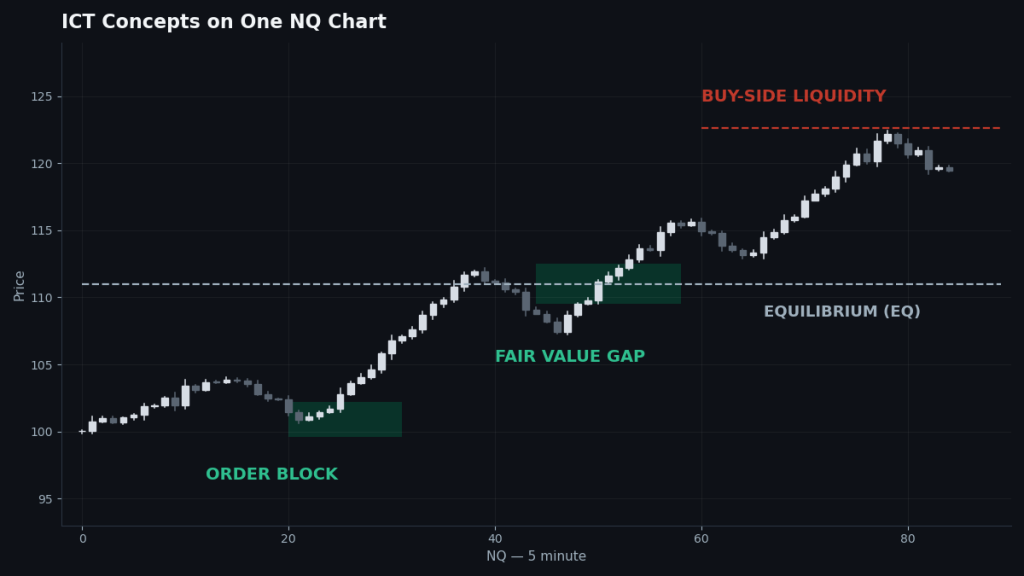
ICT trading is a method of reading price action developed by Michael J. Huddleston, known online as the Inner Circle Trader. Instead of indicators, it teaches you to read what price is actually doing: where it has been, where the stops and pending orders are sitting, and where price is most likely to go next. The core idea is simple. Large institutions move price from one pool of orders to another, and if you learn to see the market that way — structure, liquidity, and the premium and discount areas in between — you stop guessing and start reading. This guide is the full map of ICT concepts, written for futures traders, with every idea shown on the Nasdaq 100 (NQ).
What is ICT trading?
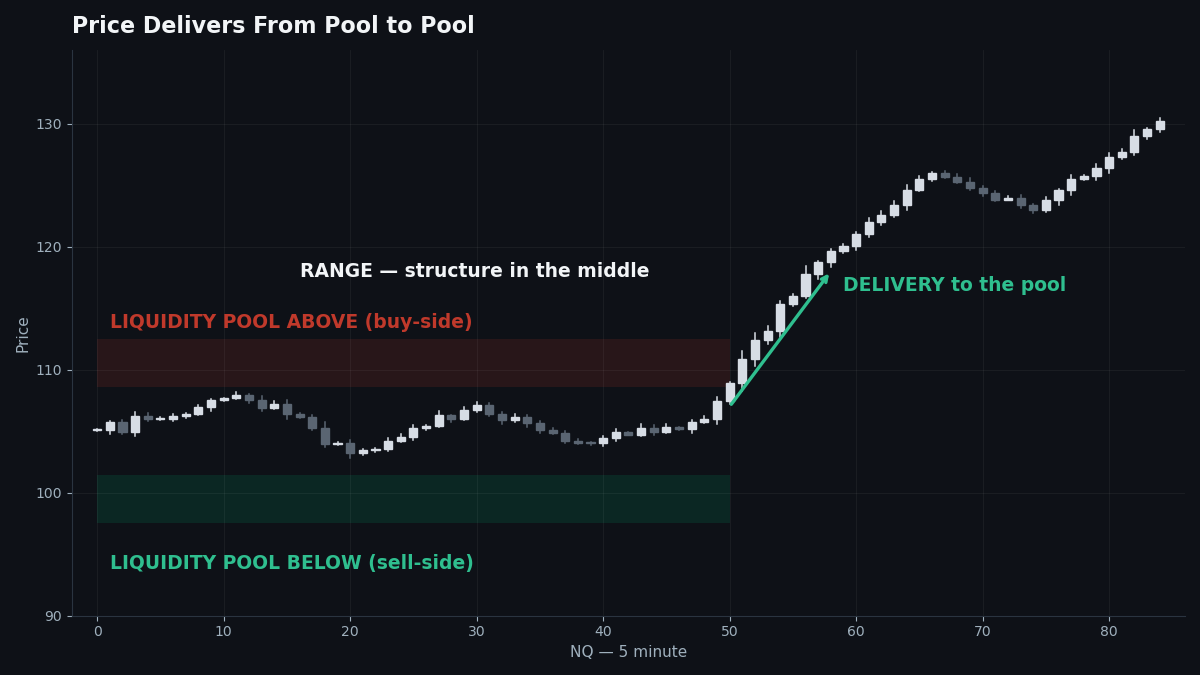
ICT stands for Inner Circle Trader. The name comes from Huddleston’s mentorship, but today “ICT” mostly refers to the methodology itself: a set of concepts for interpreting price delivery. The foundation is a claim about how markets actually work. Price is not random, and it is not driven by retail buying and selling pressure in the way most chart patterns suggest. Price moves because an algorithm delivers it between two things: liquidity (clusters of stop orders and pending orders) and fair value (areas where price moved too fast and left unfinished business behind).
Everything in ICT hangs off that one loop:
- Price builds a range and lets orders accumulate above and below it.
- Price reaches for the orders on one side — that is the move most traders call a breakout or a breakdown.
- Price then delivers toward fair value or toward the orders on the other side.
If that sounds abstract, it becomes concrete fast once you work through the handful of core concepts below. There are not hundreds of them. There is one framework, viewed from a few angles.
The core ICT concepts
Market structure
Structure is the skeleton. Swing highs and swing lows, breaks of structure (BOS), changes of character (CHoCH), and market structure shifts (MSS) tell you whether the market is trending, ranging, or reversing — and they tell you in what order things happened. Until you can read structure, every other concept floats. Start with our full guide to ICT market structure.
Liquidity
Liquidity is the fuel. Equal highs, equal lows, old highs and lows, and session highs and lows are all places where stop orders rest. ICT traders map those pools first and ask where price is being drawn to, because price is drawn to stops the way water runs downhill. The sweep of a pool — the quick raid above an old high that immediately fails — is one of the highest-value events on a futures chart. Full guide: ICT liquidity and the liquidity sweep.
Premium and discount
Between any high and low there is a halfway point: equilibrium. Above it, price is in premium (expensive relative to the range); below it, discount (cheap). Institutions buy in discount and sell in premium, and a huge amount of ICT entries reduce to waiting for price to reach the right half of the right range before doing anything. Full guide: premium and discount in ICT.
PD arrays
A PD array is any price level or zone the algorithm uses while delivering price: fair value gaps, order blocks, breaker blocks, mitigation blocks, rejection blocks, liquidity voids. These are the tools price uses inside the structure — the specific places where entries, targets, and invalidation live. PD arrays are Week 2 of this section, and they only make sense after the four foundations above.
Week 2 covers them in full: Fair Value Gap, Order Blocks, Breaker & Mitigation Blocks, Rejection Blocks & Liquidity Voids, and Dealing Range & IPDA.
Time
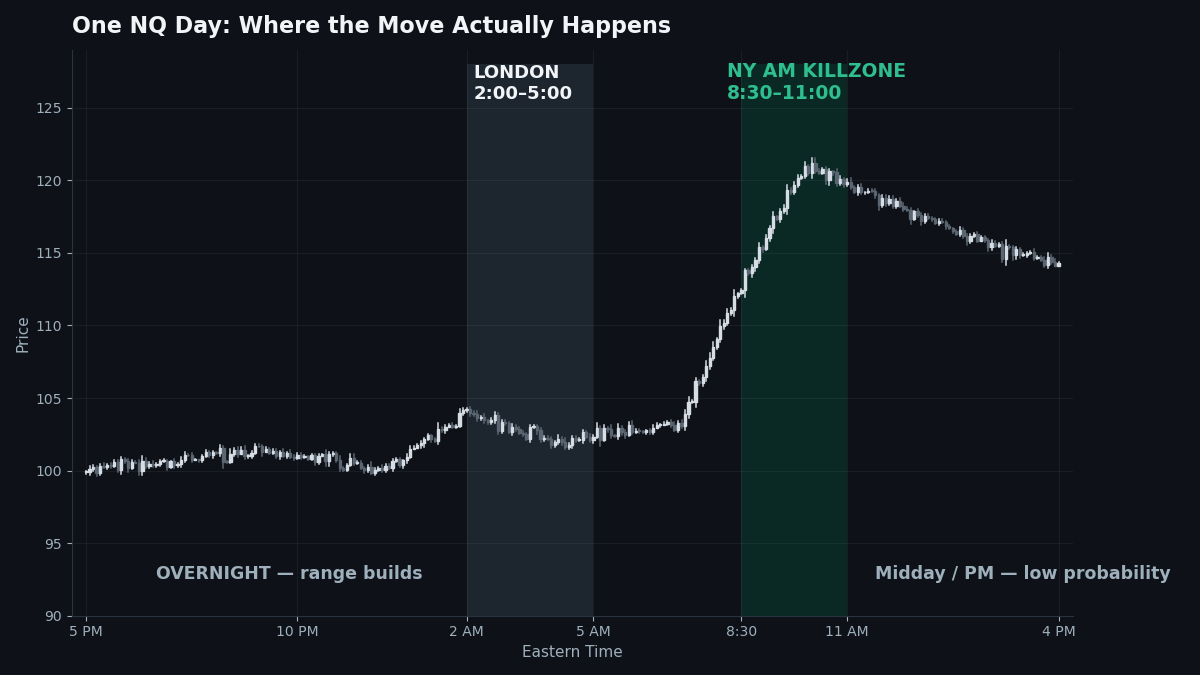
ICT is as much about when as where. Price does its real work in specific windows — the killzones — and sits dead in between. On NQ, the New York AM session (roughly 8:30–11:00 a.m. ET) is where the day’s main move usually forms. Time concepts, sessions, and the models built on them are Week 3 of this section.
What is ICT trading used for on futures?
Most ICT material online is forex-first. The concepts transfer to futures cleanly — arguably better, because NQ trades on a central exchange with real volume and clean, single-feed price action. Here is how the framework runs on a normal NQ morning:
- Before the open, you mark the overnight range, yesterday’s high and low, and any equal highs or lows nearby. Those are today’s liquidity pools.
- At the 8:30 a.m. ET data releases and the 9:30 cash open, price frequently makes its first aggressive move — often a raid on one of the pools you marked.
- After the raid, you watch structure. A market structure shift against the raid direction, with displacement, is the market telling you the raid was the manipulation, not the move.
- The entry comes on a return to fair value — a gap or block left by the displacement — in discount if you are buying, premium if you are selling.
- The target is the liquidity on the other side: the pool price was always being drawn toward.
That sequence — raid, shift, retracement, delivery — is the skeleton of the ICT 2022 Model, and every concept page in this section feeds into it.
How do you learn ICT, in order?
The internet’s problem with ICT is not a lack of content; it is the order. Traders jump to order blocks and fair value gaps — the flashy parts — with no structure or liquidity underneath, and then wonder why the same setup works on Tuesday and fails on Thursday. Learn it in this order:
- What is ICT trading? — the premise, the vocabulary, and how the pieces fit.
- Market structure — swings, BOS, CHoCH, MSS. Non-negotiable first skill.
- Liquidity — pools, inducement, the sweep. This is what price is for.
- Premium and discount — where inside a range you are allowed to act.
- PD arrays (Week 2) — fair value gaps, order blocks, breakers, and the rest of the entry tools.
- Time and models (Week 3) — killzones, the Power of Three, Silver Bullet, Judas Swing, the 2022 Model, OTE, SMT divergence.
- Application (Week 4) — our flagship page on running the whole framework on NQ futures, a full ICT glossary, and a comparison of the models so you can pick one and stick with it.
The ICT vocabulary at a glance
You will meet these terms on every page of this section. Each has a full guide linked from the learning path above; here is the one-line version of each, in the order you will use them.
- Market structure — the sequence of swing highs and lows that shows who is delivering price.
- BOS (break of structure) — a close through a swing in the trend’s direction; continuation.
- CHoCH (change of character) — the first close against the trend; a warning, not a reversal call.
- MSS (market structure shift) — a change of character after a liquidity raid, with displacement; the classic reversal trigger.
- Liquidity — resting orders, mainly stops, clustered at obvious highs and lows.
- Buy-side / sell-side liquidity — the stop clusters above highs and below lows, respectively.
- Liquidity sweep (raid) — a quick push through a pool that triggers the stops and fails to hold.
- Inducement — a small, tempting pool placed in front of the real objective, to pull traders in early.
- Dealing range — the span between a significant swing high and swing low that price is working inside.
- Equilibrium (EQ) — the 50% midpoint of a dealing range; fair value for that range.
- Premium / discount — the half of the range above EQ (sell side) and below EQ (buy side).
- PD array — any level or zone price uses while delivering: gaps, blocks, and voids.
- Fair value gap (FVG) — a three-candle inefficiency where price moved so fast that one side left a gap.
- Order block — the last opposing candle (or series) before a displacement move; the footprint of the entry.
- Displacement — an aggressive, wide-range move that confirms intent and leaves fair value behind it.
- Killzone — a session window when delivery actually happens; on NQ, above all New York AM.
- Draw on liquidity — the pool price is currently working toward; your directional objective.
- IPDA — the Interbank Price Delivery Algorithm; ICT’s name for the delivery mechanism itself, and for the lookback ranges (20/40/60 days) used to find its targets.
How is this section different?
Three things. First, it is futures-first: every example is NQ (with ES where the concept needs a second market, like SMT), every time is Eastern, and the trading day is framed the way futures actually trade — a new day at the 5:00 p.m. ET futures open, not midnight. Second, every page carries a common-mistakes section, because knowing what a concept is not saves more money than another definition. Third, this section connects outward: ICT’s dealing ranges and IPDA data ranges sit right next to the Goldbach levels and Quarterly Theory we trade here, and our PO3 Journal shows the concepts on real trades, with real fills, once you are ready to see them applied.
Common mistakes when learning ICT
- Collecting concepts instead of learning the framework. Knowing forty terms and no sequence is worse than knowing four terms cold. Structure, liquidity, premium/discount, then tools — in that order.
- Trading every PD array you see. A fair value gap in premium, against structure, at 1:00 p.m. is not a setup; it is a decoration. Context decides, the array just marks the spot.
- Ignoring time. Most ICT failures on NQ are timing failures. If it is not happening in a killzone, it is probably not the real move.
- Backtesting on forex charts and trading NQ. Ranges, volatility, and session behavior differ. Learn the concepts on the instrument you trade.
- Expecting the vocabulary to be the edge. The edge is the sequence and the discipline to wait for it. The terms are just how we talk about it precisely.
FAQ
What does ICT stand for?
Inner Circle Trader — the name Michael J. Huddleston trades under. “ICT trading” refers to his methodology: reading price through market structure, liquidity, and premium/discount arrays rather than indicators.
Is ICT trading good for futures?
Yes. The concepts were popularised on forex, but they map directly onto index futures. NQ’s centralised price feed and clean session structure make liquidity pools and sweeps especially readable.
What is the first ICT concept to learn?
Market structure. Swings, breaks of structure, and market structure shifts give you the framework every other concept hangs on. Liquidity is second.
What times does ICT focus on for NQ?
The killzones — above all the New York AM session, roughly 8:30–11:00 a.m. ET, with the London session (2:00–5:00 a.m. ET) shaping the overnight range and bias.
Do I need indicators for ICT?
No. ICT is a price-action framework. Most ICT traders use nothing beyond candles, session markers, and their own level drawings.
How long does it take to learn ICT?
The core vocabulary takes weeks; using it reliably takes months of chart time. Learning the concepts in the right order — structure and liquidity before entry models — is what shortens the curve.
Where to go next
Start with What is ICT trading? if the framework is new to you, or go straight to ICT market structure if you already know the premise and want the first real skill. When you want to see the concepts earning their keep, the PO3 Journal is where our trades are broken down, and the free beginner NQ course is the structured path through all of it.