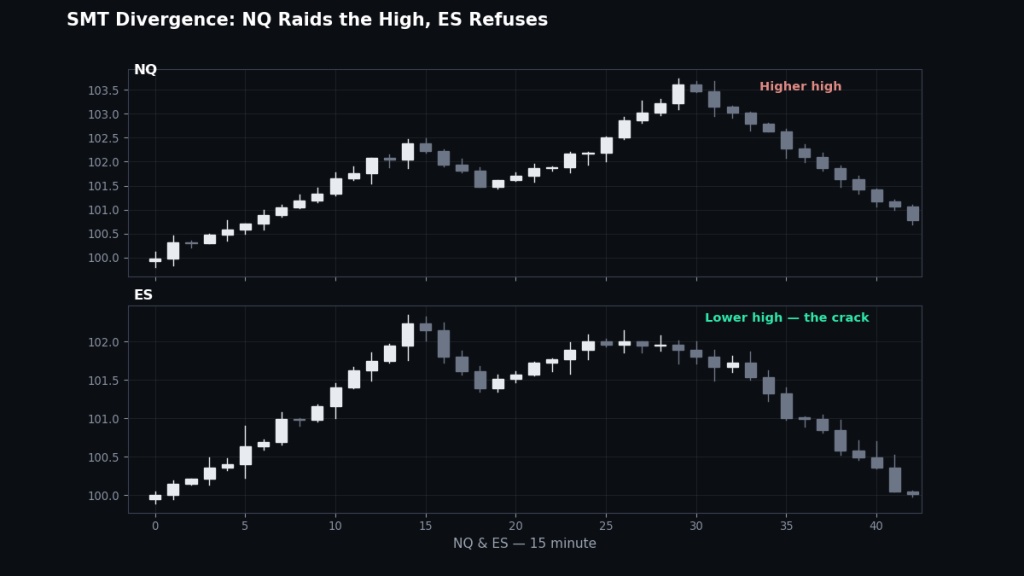
SMT divergence in ICT — SMT stands for Smart Money Technique — is a crack in the correlation between two related markets: at a high, one market makes a higher high while the other fails to, or at a low, one market takes out a prior low while the other holds above its own. On index futures the classic pair is NQ and ES: two markets that should move together, printing different extremes at the same moment. ICT reads that disagreement as a tell — the market that failed to confirm is showing the algorithm’s hand, and the divergence, printed at a liquidity pool inside a killzone, is one of the strongest confirmations a reversal setup can have. SMT does not create trades. It grades them — and on NQ versus ES it is the confirmation our section is uniquely placed to teach, because both markets are on the same trader’s screen.
What is SMT divergence?
NQ and ES are cousins: the Nasdaq 100 and the S&P 500 share most of their heavy constituents and the same macro weather, so their intraday charts normally rhyme — same swings, same timing, slightly different amplitudes. SMT divergence is the moment the rhyme breaks at the place it matters most: a swing extreme. Two forms, mirror images:
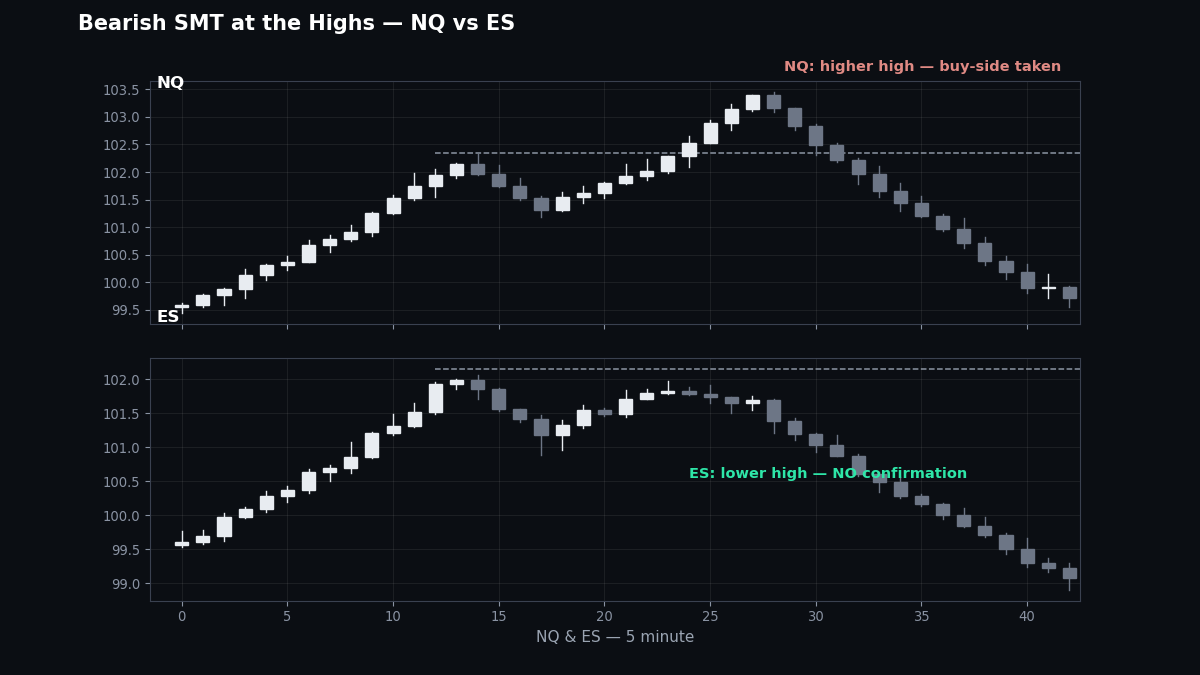
- Bearish SMT: at a high, one index pushes above its prior swing high — taking buy-side liquidity — while the other makes a lower high and refuses to take its own. The second market failed to confirm the raid. The classic read: the push was a grab, not a breakout, and the market that held back is telling you delivery is about to reverse down.
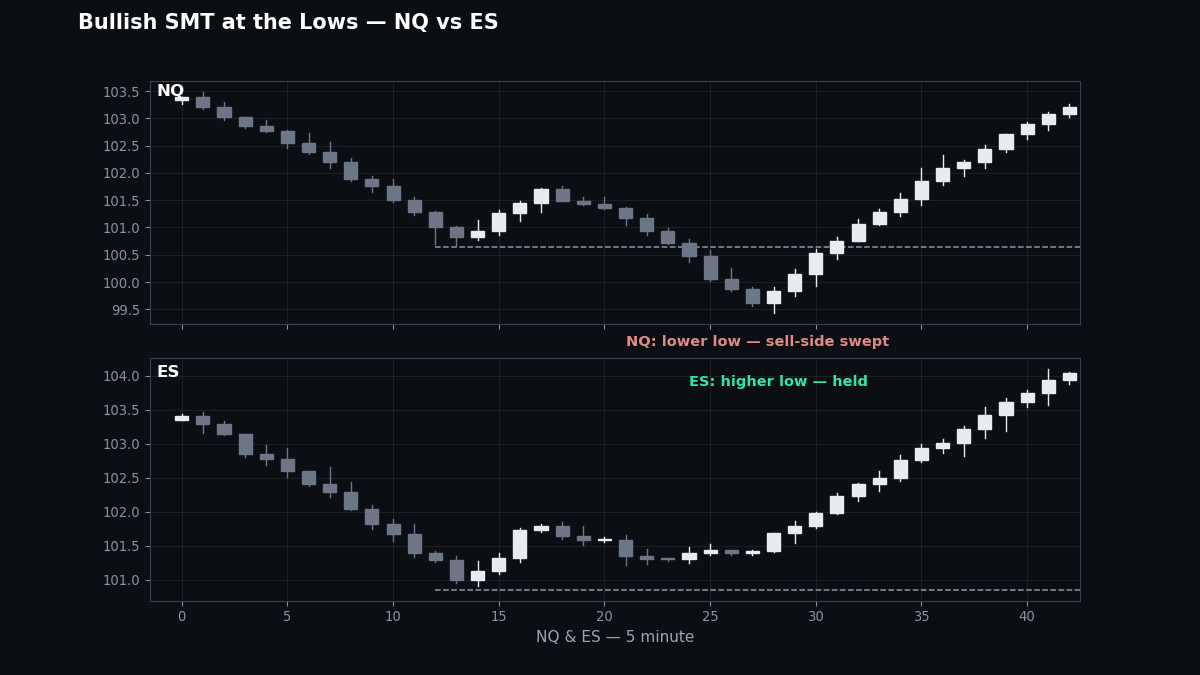
- Bullish SMT: at a low, one index sweeps below its prior swing low — taking sell-side — while the other prints a higher low and holds. One market raided its pool alone. The read inverts: the sweep was the manipulation, and the reversal up is the trade.
The detail that makes SMT more than a parlour trick: the divergence is read at pools and between correlated instruments, not between an instrument and an indicator. Both charts are price. When NQ runs the highs and ES does not, real orders fired in one market and conspicuously did not fire in the other — that asymmetry is the footprint ICT is pointing at, and it is why he files SMT under “smart money” tells rather than under patterns.
How do you identify SMT divergence?
The checklist is short, and every item on it is load-bearing:
- Put both charts up, same timeframe, same scale of swing. NQ on one, ES on the other — 5-minute or 15-minute for intraday work. SMT across mismatched timeframes (NQ 1-minute against ES 15-minute) manufactures divergences that exist only in the comparison.
- Mark the corresponding swing highs and lows on both. Corresponding is the operative word: the swing NQ made at 9:50 is compared with ES’s swing at 9:50, not with ES’s nearest convenient extreme.
- Watch the extremes get tested. Divergence only exists at the test: one market exceeds its marked swing while the other fails to exceed its own corresponding swing. In between tests, the correlation rhyming is just the normal state of things.
- Locate the divergence. An SMT at a liquidity pool — old highs or lows, equal highs or lows, a session extreme — inside a killzone is the high-grade version. An SMT in mid-range at 12:30 p.m. is a curiosity.
- Name which market raided and which held. The raider took its pool; the holder showed the hand. On NQ/ES, when NQ makes the new extreme alone, tech did the grabbing — and the reversal, when it comes, usually runs on both charts together.
How do you trade SMT divergence on NQ?
SMT is a confirmation tool with a specific seat in the sequence — it sits between the raid and the entry, and it raises or lowers your confidence in the 2022 Model’s shift:
- Start from the frame, as always. Bias and draw from the higher timeframe; a named pool price is approaching. SMT without a frame is two charts arguing.
- At the pool, watch both charts. The raid happens. If it happens in both markets together, the correlation is intact — treat the sweep as a plain sweep. If one market raids alone, SMT is present: the setup just got graded up.
- Still wait for the shift. SMT never replaces the market structure shift. The entry remains the model’s entry — displacement against the raid, retracement into the fair value gap. SMT tells you how much to trust the shift, not to skip it.
- Trade your own chart. The entry, stop and target all live on the instrument you are trading (for us, NQ). ES is the witness, not the trade. Stop beyond the raid extreme on your chart; target the opposing pool on your chart.
- Use agreement as information too. When the raid you are fading shows no SMT — both markets sweeping together with displacement through the pool — continuation risk is real, and the honest response is smaller size or no trade. SMT’s absence is data.
A concrete morning: at 10:20 a.m. NQ pushes above the morning’s equal highs and takes buy-side — while ES, at the same minutes, stalls two points under its own corresponding high and rolls over. Bearish SMT at a pool, inside the AM killzone, with price in premium of the daily range. The 5-minute shift down prints with displacement on both charts; the short on NQ fills on the gap retracement, and the delivery runs to the sell-side pool under the open. The divergence did not make the trade — the frame and the shift did — but it is why the trade was taken at full size instead of half.
Common mistakes
- Hunting SMT everywhere. Mid-range, mid-session, between minor swings: correlations flicker all day at small scales, and most of it is amplitude noise between two different instruments. SMT is an extremes tool — it means something at pools, at session highs and lows, at the test of a marked swing. Elsewhere it means nothing.
- Comparing the wrong swings. NQ’s 10:00 high against ES’s 10:25 high is not a divergence; it is two different moments. Corresponding swings, same window, same timeframe — or the comparison is fiction.
- Trading SMT as a standalone entry. Divergence with no raid at a pool, no shift, no frame is a trivia fact, not a setup. Traders who short “because ES didn’t confirm” without the sequence are fading strength on a rumour — and NQ is perfectly capable of dragging ES up behind it.
- Ignoring SMT when it argues against you. The confirmation tool only gets consulted when it agrees — that is not confirmation, it is decoration. If your short’s raid printed in both markets with displacement, that is the model talking. Listen or size down.
- Forcing SMT onto unrelated pairs. The technique needs genuinely correlated instruments sharing order flow: NQ/ES/YM, or in forex the majors against the dollar index. Two random tickers disagreeing is not SMT — there is no correlation to crack.
FAQ
What does SMT stand for in ICT?
Smart Money Technique. It is ICT’s intermarket divergence read: a crack in the correlation between two related markets at a swing extreme — one takes out its prior high or low while the other fails to take out its own.
Which markets are used for SMT divergence on futures?
The index futures against each other — primarily NQ and ES, with YM as a third witness. They share constituents and macro drivers, so their swings should rhyme; when one prints an extreme alone, that is the divergence.
What is bearish SMT divergence?
At a high, one market makes a higher high — raiding buy-side liquidity — while the correlated market prints a lower high and does not take its pool. The failure to confirm marks the push as a grab, and it supports a reversal short once structure shifts.
What is bullish SMT divergence?
At a low, one market sweeps below its prior low while the other holds a higher low. The second market refused to take sell-side — the sweep was one market’s manipulation, and the divergence supports a reversal long after the shift.
Is SMT divergence a buy or sell signal by itself?
No. SMT is a confirmation layer inside the framework: it grades a raid and the shift that follows it. The entry remains the model’s entry — displacement and the retracement into its gap — with SMT deciding confidence and size, not existence.
Can SMT divergence fail?
Yes — the leading market can pull the laggard along a few minutes later, which is why the shift, not the divergence, is the trigger. SMT read at a pool inside a killzone, confirmed by displacement, is the high-grade version; SMT alone, mid-range, is the version that fails.
Where to go next
SMT grades the raid at the heart of the ICT 2022 Model — that page has the full sequence it confirms. Its raw material is the pools from ICT liquidity, and the shift it waits for is in market structure. The full map is in the ICT section hub.