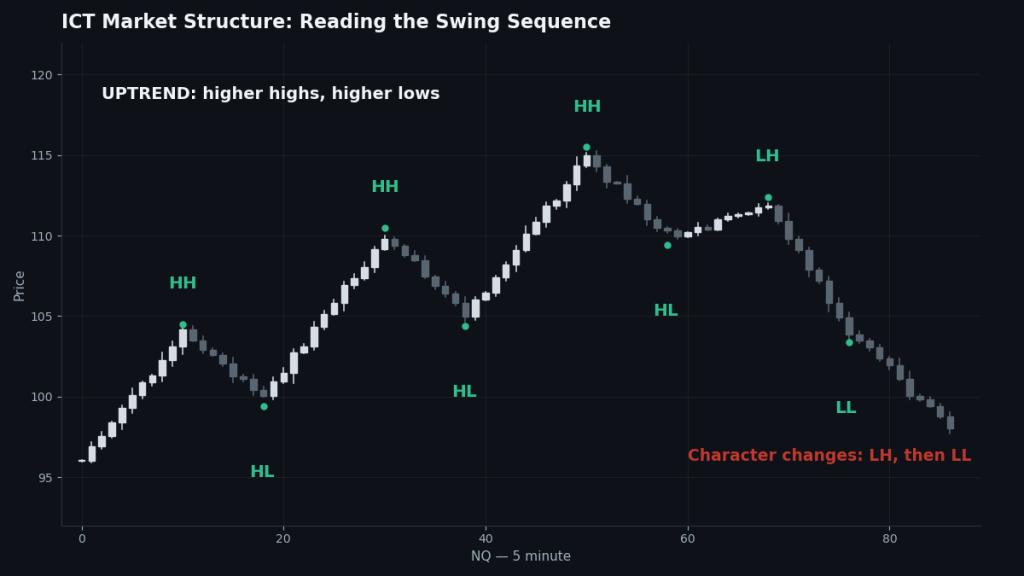
Market structure, in ICT, is the sequence of swing highs and swing lows price makes as it trends or ranges, and the breaks that occur when price closes through one of those swings. A series of higher highs and higher lows is bullish structure; lower highs and lower lows is bearish structure. When price breaks a swing in the direction of the trend, that is a break of structure (BOS) — continuation. When it breaks a swing against the trend, that is a change of character (CHoCH) or, when it follows a liquidity raid with strong displacement, a market structure shift (MSS) — the first hard evidence the trend may be over. Structure is the first ICT skill because every other concept is located inside it: a fair value gap or an order block means nothing until structure tells you whether it is with the delivery or against it.
What is market structure?
Markets move in legs. Each leg ends at a swing point — a high with lower highs on both sides, or a low with higher lows on both sides — and the relationship between consecutive swings is the structure. Rising swings mean the algorithm is delivering price upward; falling swings mean downward delivery; overlapping swings with no progress mean a range, where the honest trade is usually patience.
ICT adds one refinement most structure teaching skips: there are two structures on every chart. External structure is the major swings — the highs and lows that define the range everyone can see, where the big liquidity pools sit. Internal structure is the smaller swings inside the current leg. Internal structure flips back and forth constantly and is mostly useful for timing; external structure is the story. Confusing the two — treating every internal flip as a trend change — is the single most common structure error, and we will come back to it in the mistakes section.
How do you identify market structure?
Work through these steps, in order, on the timeframe you are analysing:
- Mark the swings. Identify the clear swing highs and lows. If you cannot see it without squinting, it is internal noise, not a swing that matters.
- Label the sequence. HH/HL (bullish), LH/LL (bearish), or mixed (range). The label of the most recent external sequence is your structural bias.
- Draw the lines that matter. The most recent swing high and swing low of the external structure are your decision levels. Price closing through them is an event; price wicking through them is usually a liquidity raid — different things, different responses.
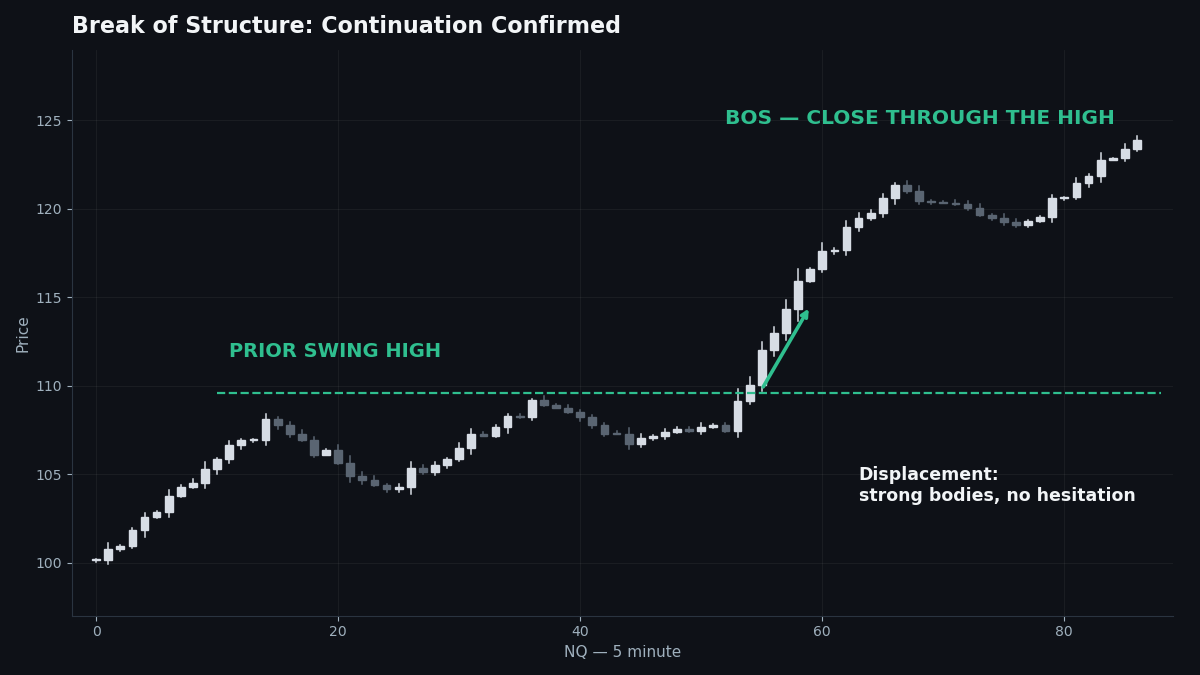
- Watch the close, not the poke. Structure breaks are confirmed by a candle close through the swing, ideally with displacement — a strong body that leaves a fair value gap behind it. A wick through a high that closes back inside has not broken anything; it has taken liquidity.
- Update the map. After a break, the protected swing flips: in an uptrend the most recent higher low is now the line that, if closed through, changes the read.
Break of structure (BOS)
A BOS is a close through a swing in the direction of the existing trend: in an uptrend, price closes above the previous higher high. It confirms the algorithm is still delivering in the same direction and the previous range’s high is now just a stepping stone — usually after resting liquidity above it was collected. ICT traders treat a BOS as permission to look for continuation entries on retracements, in discount of the new leg.
Change of character (CHoCH)
A CHoCH is the first close against the trend: in an uptrend, price closes below the most recent higher low. It does not prove reversal — it warns that delivery is changing character. In strong trends the first CHoCH fails constantly; in tired trends after a liquidity raid, it is the earliest useful warning. Treat it as a yellow light: stop pressing the old direction, wait for confirmation.
Market structure shift (MSS)
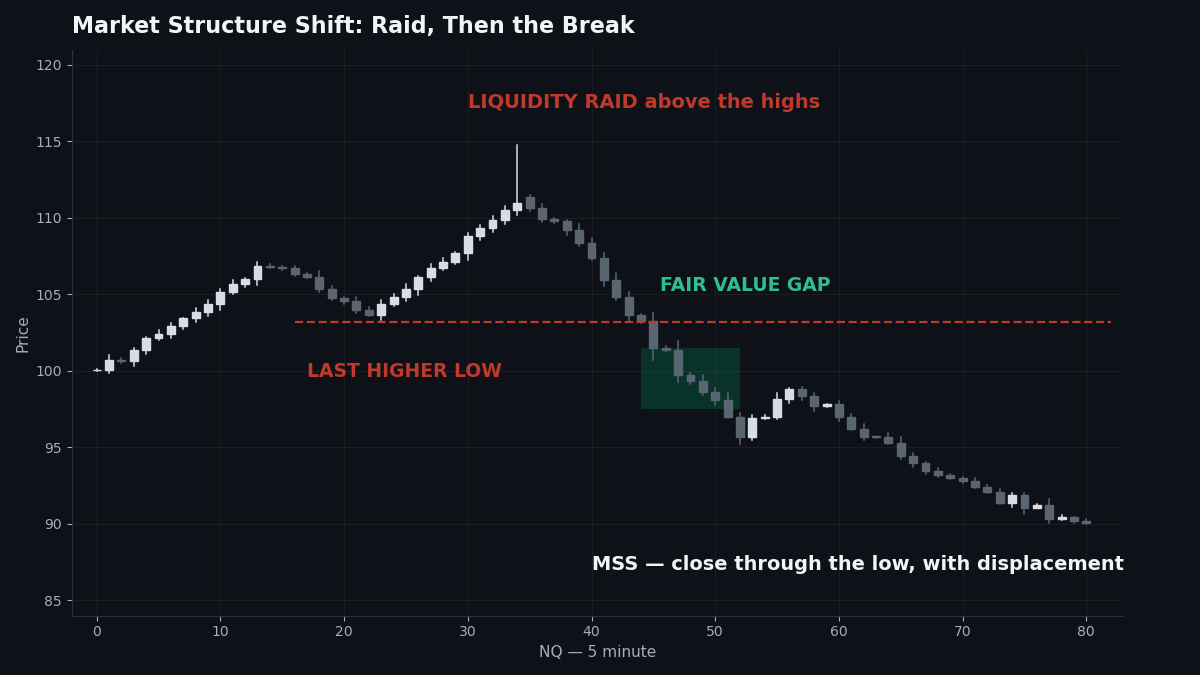
An MSS is a CHoCH with conditions: it happens after price has raided a meaningful liquidity pool (an old high, an old low, equal highs or lows), and the break comes with displacement — aggressive candles that leave a fair value gap. That combination is the backbone of the ICT 2022 Model: raid, then shift, then enter on the retracement into the gap the shift created. An MSS on the 1-minute or 5-minute chart, aligned with the higher-timeframe draw on liquidity, is one of the highest-quality reversal signals the framework offers.
How do you trade market structure on NQ?
Structure gives you three jobs: bias, permission, and invalidation.
- Bias. The external structure on the 15-minute and 1-hour charts decides which direction you are allowed to trade today. Bullish structure plus a draw to buy-side liquidity above: you are a buyer on retracements. Anything else is scenery.
- Permission. You do not enter because price reached a level; you enter because structure shifted or continued at that level. On NQ mornings the classic sequence is: overnight range, raid of the London or pre-market extreme at the New York open, MSS on the 1–5 minute chart, entry on the gap. Structure is the trigger that turns a watched level into a trade.
- Invalidation. Structure hands you the stop. A long after an MSS is wrong when price closes back through the swing that created the shift. No opinion, no debate — the map updated, the trade is done.
A worked example: NQ trends up into 10:00 a.m. ET making higher highs, then runs the morning high by a few points — a raid of the stops above it — and stalls. A 5-minute close below the last higher low, with a strong red displacement candle, is an MSS. The trade is short on the retracement into the displacement’s fair value gap, stop above the raid high, target the sell-side pool below. Every element of that trade is a structure read.
Common mistakes
- Calling every internal wiggle a trend change. Internal structure flips all day. If you reverse your bias on every 1-minute CHoCH, you will pay the spread and the range all session.
- Counting wicks as breaks. A wick through a swing high is a liquidity raid until a candle closes through it. Traders who treat pokes as BOS end up buying the exact top the algorithm was selling into.
- Ignoring which swing matters. Not all highs are equal. The swing that matters is the one guarding the current leg — usually the most recent external swing in the trend direction. Breaking a minor internal high inside a downtrend changes nothing.
- Trading structure without a draw. A BOS toward nothing is just movement. Structure works when it is aimed at a liquidity pool or a premium/discount objective; combine this page with the ICT liquidity guide.
- Marking structure in hindsight only. If your swings only become obvious after the move, your swing definition is too loose. Decide your swing rule (for example, a high with two lower highs either side on your timeframe) and apply it mechanically, live.
FAQ
What is a break of structure (BOS) in ICT?
A candle close through a swing point in the direction of the current trend — above the prior higher high in an uptrend, below the prior lower low in a downtrend. It signals continuation.
What is the difference between CHoCH and MSS?
A change of character is any first close against the trend. A market structure shift is the specific, higher-quality version: it follows a liquidity raid and breaks structure with displacement, leaving a fair value gap. Every MSS is a CHoCH; not every CHoCH is an MSS.
Which timeframe is best for ICT market structure?
Use higher timeframes (1-hour, 15-minute) for bias and external structure, and lower timeframes (5-minute, 1-minute) for the shift that triggers an entry. The concept is fractal — it exists on all of them — but the roles differ.
Does a wick above a swing high break structure?
No. In ICT, a wick through a swing is treated as a liquidity raid. Structure breaks on a close through the swing, preferably with displacement.
What is internal vs external market structure?
External structure is the major swings that define the visible range and hold the main liquidity. Internal structure is the minor swings inside the current leg, useful for timing entries but not for setting bias.
How do I know if structure is bullish or bearish?
Read the last external sequence: higher highs and higher lows is bullish, lower highs and lower lows is bearish, and overlapping swings with no net progress is a range — where the correct read is “no bias.”
Where to go next
Structure is half the map; ICT liquidity is the other half — it explains what those swing points are for. Then premium and discount shows you where inside the structure you are allowed to act. All of it is indexed in the ICT section hub.