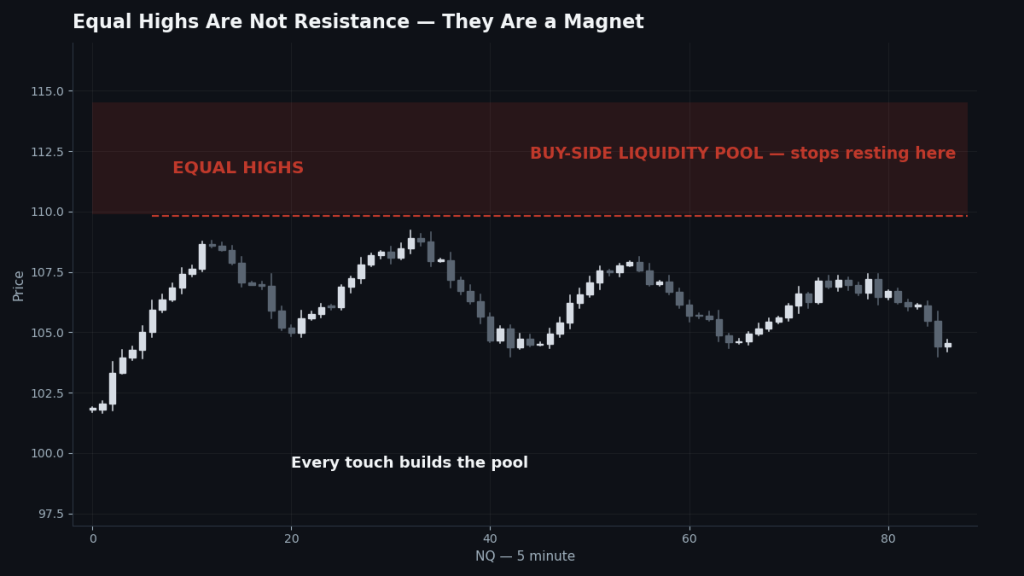
In ICT, liquidity means resting orders — above all stop orders — clustered at obvious price levels: above old highs, below old lows, and above or below the equal highs and lows traders love to draw lines on. Price is drawn to those clusters because large positions can only be filled where orders exist. A liquidity pool is any level where those stops have accumulated; a liquidity sweep (also called a raid or a stop hunt) is the quick push through the level that triggers them, usually followed by a reversal or a sharp continuation once the orders are consumed. If market structure is the map of an ICT chart, liquidity is the reason the route exists: price is almost always on its way to a pool, coming back from one, or building one.
What is liquidity in ICT?
Forget the textbook definition (ease of trading without moving price). In ICT usage, liquidity is practical: it is the fuel sitting at levels everyone can see. Think about who places orders at an old high. Shorts put their stops just above it. Breakout traders put buy-stops just above it. Both are buy orders. When price reaches that level, those orders fire together, and someone large can sell into them without pushing price down on themselves. That is why obvious levels get run so often — not despite being obvious, but because they are obvious.
ICT splits liquidity into two working types:
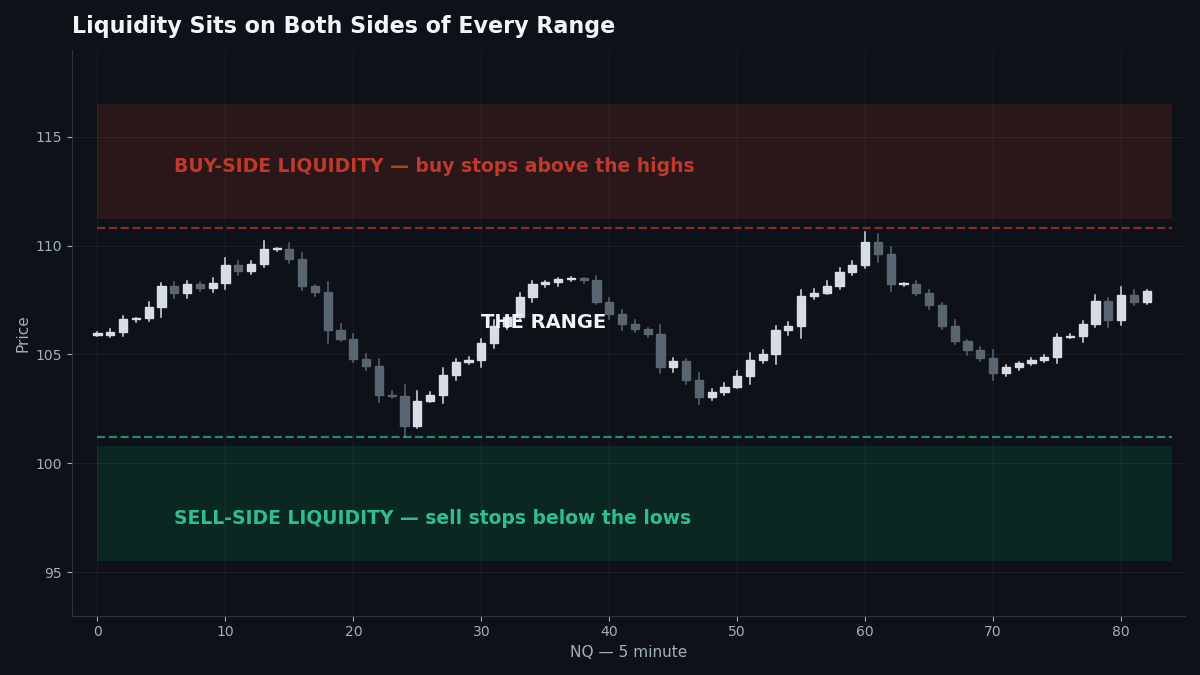
- Buy-side liquidity (BSL): the buy stops resting above highs — old highs, equal highs, session highs, yesterday’s high. Price reaching up into BSL is said to be taking buy-side.
- Sell-side liquidity (SSL): the sell stops resting below lows — old lows, equal lows, session lows, yesterday’s low. Price dipping into SSL is taking sell-side.
At any moment, the most useful question on an NQ chart is: which pool is closest, which is largest, and which way is structure pointing? The answer is your draw on liquidity — the direction price is most likely working toward.
How do you identify liquidity pools?
Liquidity is identified by eye, on purpose: if you can see it, so can every other trader, which is exactly why the stops are there. Mark these, in rough order of importance on a futures chart:
- Equal highs and equal lows. Two or more swings at nearly the same price. Retail sees a double top and sells; ICT sees a engineered pool of stops sitting just beyond it. Equal levels are the most reliable pools on the chart.
- Old highs and lows. Yesterday’s high/low, last week’s high/low, and prominent swing points from prior days. The older and more respected the level, the more orders reference it.
- Session extremes. The overnight high/low, the London high/low, and the pre-market range on NQ. These are the pools the New York session most often works with.
- Relative equal highs/lows inside a range. Even minor repeated tests build a pool. Three touches of the same level inside an hour is a pool, not a coincidence.
- Inducement. A small, tempting pool placed in the path of the “obvious” trade — a minor equal high just before the real high, an early low inside a range. Inducement exists to pull traders in early and stop them out on the way to the real pool. When a small pool sits just in front of a bigger story, suspect it is bait.
What is a liquidity sweep?
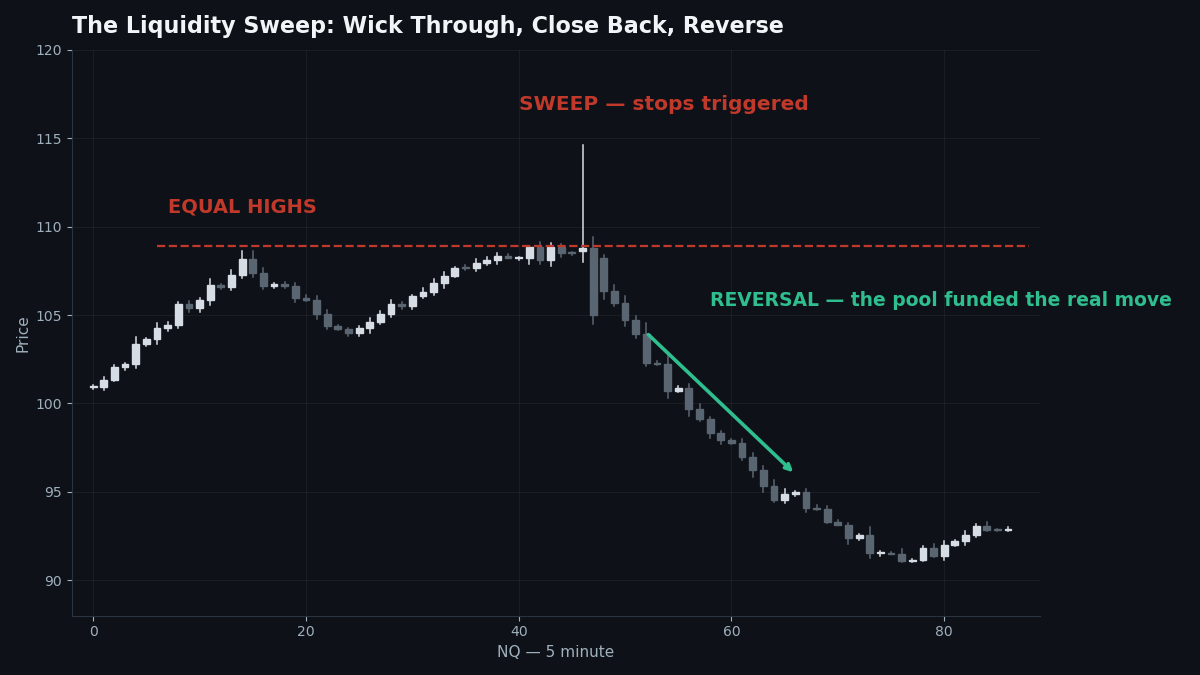
A liquidity sweep is the event, not the level: price pushes through a pool, triggers the stops, and the move fails to hold — a long wick through the highs that closes back inside the range, often within one or two candles. Also called a liquidity raid, a stop run, or (when it is the fake move before the real one at the open) a Judas swing.
The mechanics matter. The sweep is how the algorithm fills the large position: the stops above the highs are the buy orders that let a big seller sell. Once filled, there is no reason to stay up there, and price leaves — frequently with the strongest displacement of the day. That is why the sweep, followed by a market structure shift, is the trigger sequence behind the ICT 2022 Model and most of this framework’s reversal trades.
Not every pass through a level is a sweep-and-reverse. If price takes a pool and holds above it with displacement and a structural break, that is continuation — the pool funded the next leg instead of ending it. The distinction is always the same: what does structure do in the minutes after the raid?
How do you trade liquidity on NQ?
Liquidity is traded as a map first and a signal second. The working method:
- Mark the pools before the session. Prior day high/low, overnight extremes, equal highs/lows. Know what is above you and what is below you before 8:30 a.m. ET.
- Name the draw. Based on structure and the higher-timeframe picture, decide which pool price is working toward. This is your directional bias for the morning.
- Let price reach the pool. The amateur trade is shorting into approaching buy-side liquidity. The ICT trade is waiting for the raid, then reading structure.
- Trade the reaction, not the level. After the sweep: an MSS against the raid direction, with displacement, sets up the reversal entry on the retracement. If instead structure breaks through the pool, stand aside or trade continuation on the next retracement — never fade a pool that price is accepting above.
- Target the next pool. Entries after a buy-side raid target the sell-side pool below — price delivers from pool to pool. Your target was on the map before you entered.
A concrete NQ morning: overnight, price bases under equal highs at the pre-market top. At 9:30 the cash open spikes through them by a few points — buy-side taken — and prints a long upper wick. A 5-minute close back below the last higher low with displacement is the shift. The trade is short into the retracement, stop above the raid, target the overnight lows where the sell-side sits. Every step was a liquidity read.
Common mistakes
- Shorting equal highs because “it’s a double top.” Equal highs are not resistance; they are a magnet and then a fuel station. The classic ICT trade is the move after they are taken, not a fade in front of them.
- Treating every sweep as a reversal. A sweep into a higher-timeframe premium array with an MSS is a reversal setup. A sweep with continuation structure is just the trend refuelling. Context — as always — is the difference.
- Marking every tiny high as a pool. Two 1-minute wiggles at the same price inside chop is not institutional liquidity. Pools need to be levels the broader market can see and reference.
- Ignoring inducement. If price takes a small pool and your setup “almost” triggers, check whether the real pool is still sitting beyond it. Getting induced early is how most traders donate their stop to the real move.
- Placing your stop where everyone else’s is. If your invalidation sits exactly on the obvious level, your stop is the liquidity. Size and place with the raid in mind — the pool gets visited before the move, by design.
FAQ
What is liquidity in ICT trading?
Resting orders — mainly stops — clustered at obvious levels like old highs, old lows, and equal highs or lows. Price is drawn to those clusters because large orders need them to fill.
What is the difference between buy-side and sell-side liquidity?
Buy-side liquidity is the buy stops resting above highs; sell-side liquidity is the sell stops resting below lows. Price “takes” buy-side when it runs a high, and sell-side when it runs a low.
What is a liquidity sweep?
A quick push through a liquidity pool that triggers the stops there, followed by price failing to hold beyond the level — usually a wick through the highs or lows that closes back inside. It is also called a raid or stop run.
What is inducement in ICT?
A small, obvious pool placed to tempt traders into early entries — a minor equal high or low in front of the real objective. Price takes the inducement, stops those traders out, and uses their orders on the way to the main pool.
How do you know if a sweep will reverse or continue?
Watch structure after the raid. A market structure shift against the raid, with displacement, argues reversal. A close and hold through the pool with a break of structure argues continuation.
Which liquidity pools matter most on NQ?
The prior day’s high and low, overnight and London session extremes, and equal highs or lows near current price — in the New York AM killzone, those are the pools the day is usually built around.
Where to go next
Liquidity tells you where price is going; ICT market structure tells you what it is doing on the way, and premium and discount tells you where inside the range you may act. The full map is in the ICT section hub.