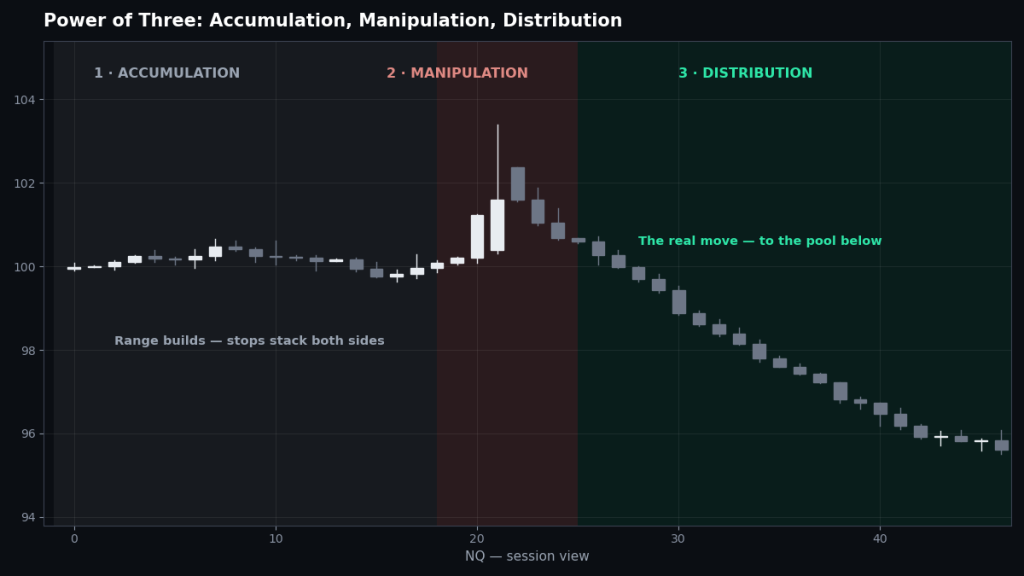
The Power of Three — PO3, also called AMD — is ICT’s model of how every move is built, in three phases: accumulation, manipulation and distribution. First, price accumulates in a range, stacking orders above and below it. Then it manipulates: a false move out of the range that raids one side’s liquidity, traps the traders who chased it, and prints the session’s extreme. Finally it distributes: the real move, delivering through the range and on toward the true objective on the other side. The pattern is fractal — it shapes a single candle, a New York session, a full trading day and an entire week — and it is the pattern this site is named for.
What is the Power of Three?
Strip the ICT vocabulary away and the Power of Three is a claim about sequence. Markets do not trend out of nowhere. Before a real move, two things have to happen: orders have to accumulate somewhere (a range), and the stops resting around that range have to be harvested (a raid). Only then can price deliver efficiently in the direction it was always going. Accumulation builds the fuel. Manipulation lights it — in the wrong direction, briefly, on purpose. Distribution is the fire.
The three phases, in the order you will actually meet them:
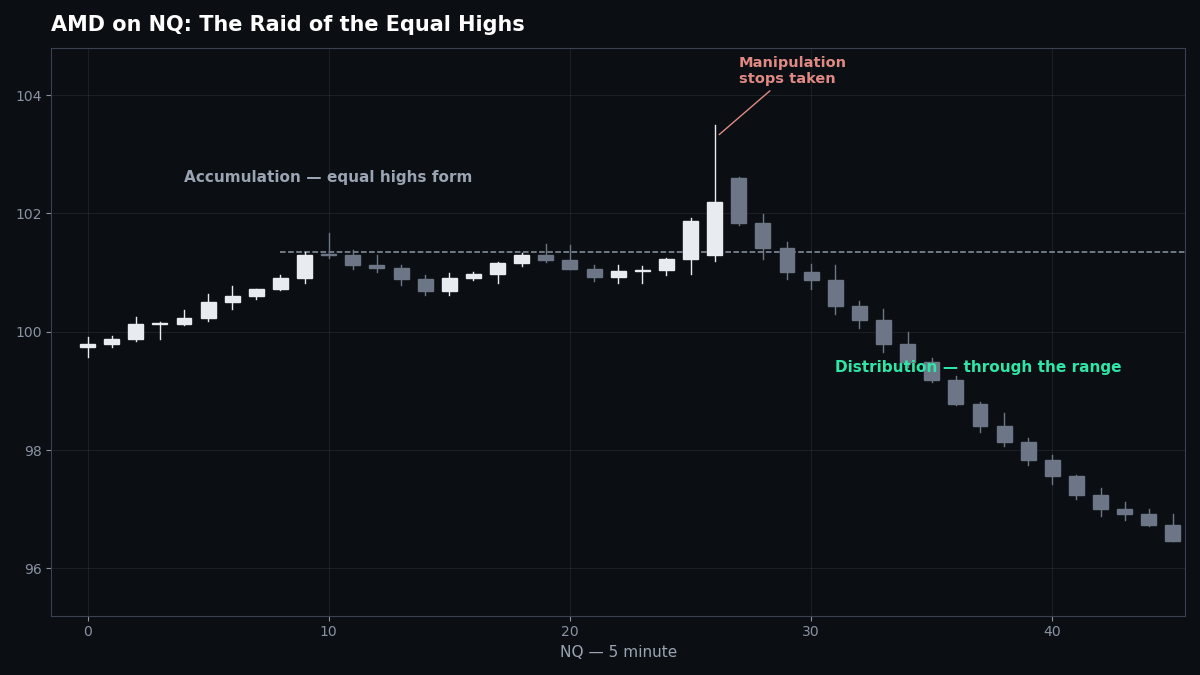
- Accumulation — price trades sideways in a defined range, usually near an open: the overnight session before New York, the morning before the cash open, the first days of a week. Equal highs and equal lows form. Traders take positions on both sides and place their stops just outside the range — which is exactly where the algorithm wants them.
- Manipulation — price breaks out of the range the wrong way. It sweeps the stops on one side, prints what looks like a breakout, and fails. This is the Judas swing when it happens at a session open. The manipulation phase usually prints the day’s high or low — the extreme the rest of the session trades away from.
- Distribution — the real delivery. Price moves through the range with displacement, revisits fair value on retracements, and works toward the liquidity on the far side. Distribution is the only phase you are paid in. The other two phases exist to set it up — and to take money from traders who mistake them for it.
The three phases in detail
Accumulation: the range is the setup
Accumulation is boring by design. While price chops inside the range, nothing about it screams “trade here” — and that is the point. Every hour inside the range adds stops above its high and below its low, and both pools grow. For the ICT trader, accumulation is a marking exercise: draw the range, note its extremes, note where the larger draw on liquidity sits relative to it. The range tells you where the manipulation will strike; the draw tells you which side of the range the distribution will eventually leave from.
Manipulation: the move that lies
The manipulation is the most expensive candle or two of the day for most traders, because it is engineered to look like the start of something. Price pushes through the range extreme with urgency — often at a session open, often on a data release — and breakout traders pile in while range traders get stopped out. Then it stalls, and the tells appear: no follow-through displacement in the breakout direction, a wick back into the range, and then the real signal — a market structure shift against the manipulation, with displacement and a fair value gap. The manipulation is over when structure says so, not when the candle looks scary.
Distribution: the move that pays
Distribution is delivery with intent: strong bodies, order blocks respected on retracements, gaps holding as price works from pool to pool. It begins after the shift and it ends at the objective — the opposing pool, the far side of the larger dealing range, equilibrium of the weekly range, wherever the draw was. Distribution is also where discipline matters most, because the phase invites adding, chasing and overstaying. The phase ends the same way the manipulation did: a raid of the target pool, a stall, a shift. Until then, retracements inside distribution are entries, not warnings.
How do you identify the Power of Three?
Work the phases in order — the model is a checklist, not a vibe:
- Find the accumulation. A defined range with obvious extremes, ideally around an open: the Asian/overnight range, the pre-market range, Monday’s range in a weekly profile. No range, no PO3.
- Name the draw. Which pool is the day (or week) actually working toward, from the higher-timeframe premium and discount picture? The manipulation will strike the opposite side first.
- Wait for the manipulation raid. Price sweeps the range extreme on the wrong side — the high gets run before a bearish day, the low before a bullish one. Patience here is the entire model.
- Confirm with the shift. A market structure shift against the manipulation, with displacement, starts distribution. Enter on the retracement into the gap or block the shift left behind.
- Target the far side. Distribution’s objective is the pool beyond the accumulation range on the distribution side — and often the next pool beyond that. The manipulation extreme is your invalidation reference.
How do you trade the Power of Three on NQ?
The cleanest expression is the intraday one, and it runs on rails most New York mornings:
- Accumulation: the overnight session builds the range after the 5:00 p.m. ET open; the Asian range and London’s early trade define the extremes you will trade against.
- Manipulation: the 8:30 data release or the 9:30 cash open raids one extreme — the Judas push through the overnight high or low that prints the day’s eventual high or low in the first hour.
- Distribution: after the shift, price delivers through the morning — the New York AM killzone move — toward the pool on the other side, frequently completing by 11:00 a.m.
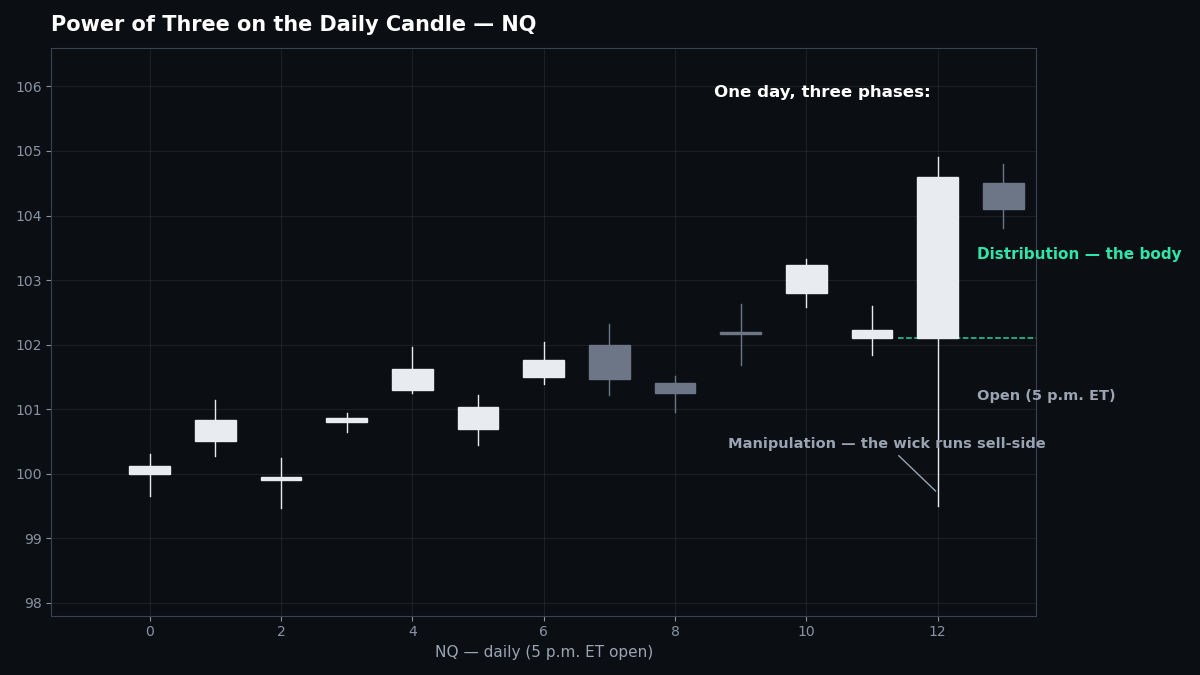
The same three phases draw the daily candle: the futures day opens at 5:00 p.m. ET, accumulation happens around the open, manipulation runs one side of the opening price (the wick of the daily candle), and distribution is the body that closes far from the manipulation extreme. A daily candle with a small wick at one end and a long body is PO3 drawn by the market itself — and it is why ICT traders watch where price sits relative to the day’s open before they watch anything else. The weekly profile is the fractal one level up: Monday accumulates, midweek manipulates, late week distributes. You will not trade all three scales, but you should know which scale’s distribution you are inside before you take a trade on any of them.
Common mistakes
- Trading the manipulation. The false move is fast, emotional and looks like the day’s trade. Buying the sweep of the highs because “it’s breaking out” is paying for someone else’s distribution. The manipulation is the setup forming, never the entry.
- Calling any range a PO3. Accumulation only counts when it is building toward something — a named draw on the other side. A range in the middle of nowhere, with no pool beyond it, is just a range, and most of them resolve as chop, not AMD.
- Assuming manipulation must reverse hard. Sometimes the “raid” keeps going — that was not manipulation, it was the start of distribution through the range, and structure will say so with displacement and closes outside. PO3 describes a common sequence, not a law that every breakout fails.
- Losing the anchor. Each scale of PO3 is anchored to an open: the session open intraday, the 5:00 p.m. ET futures open for the daily candle, Monday for the week. Measure the phases against the wrong open and the whole read rotates into nonsense.
- Expecting all three phases, every day. Some days never leave accumulation (pre-holiday sessions, dead data weeks); some manipulate twice. The model earns its keep by telling you what has not happened yet — not by forcing a three-act play onto a one-act day.
FAQ
What does AMD stand for in ICT?
Accumulation, manipulation, distribution — the three phases of the Power of Three. Accumulation builds the range and the stops around it, manipulation raids one side of it, and distribution is the real delivery to the other side.
Is the Power of Three the same as Wyckoff’s accumulation and distribution?
The shapes rhyme — both describe ranges that resolve into markup or markdown — but the mechanics ICT teaches are different: the manipulation phase is specifically a liquidity raid engineered to trigger the stops the accumulation placed, and the phases are anchored to session opens and killzones, which Wyckoff never dealt in.
On which timeframe does the Power of Three work?
All of them — it is fractal. The intraday version (overnight accumulation, open manipulation, AM distribution) is the one NQ day traders use most; the daily-candle and weekly versions frame bias for the smaller ones.
How do you know the manipulation phase is over?
Price tells you: the raid stalls, and a market structure shift against the manipulation prints with displacement, leaving a fair value gap. That shift is the starting gun for distribution — and the moment the model becomes tradeable.
Is the Judas swing the same thing as manipulation?
It is the intraday name for it. The Judas swing is the manipulation phase arriving at a session open — the false move through the range extreme at London or New York that traps traders before distribution begins.
What is the entry in a Power of Three trade?
Not the raid — the retracement after the shift. Distribution begins with displacement, and the entry is the return into the fair value gap or order block that displacement left, in the distribution direction, with the manipulation extreme as invalidation.
Where to go next
The manipulation phase has its own page: the Judas swing is PO3’s second act in detail. The clock that schedules the phases is in ICT killzones, and the model that trades the distribution phase step by step is the ICT 2022 Model. The full map is in the ICT section hub, and the foundations — market structure and liquidity — are what tell the phases apart in real time.