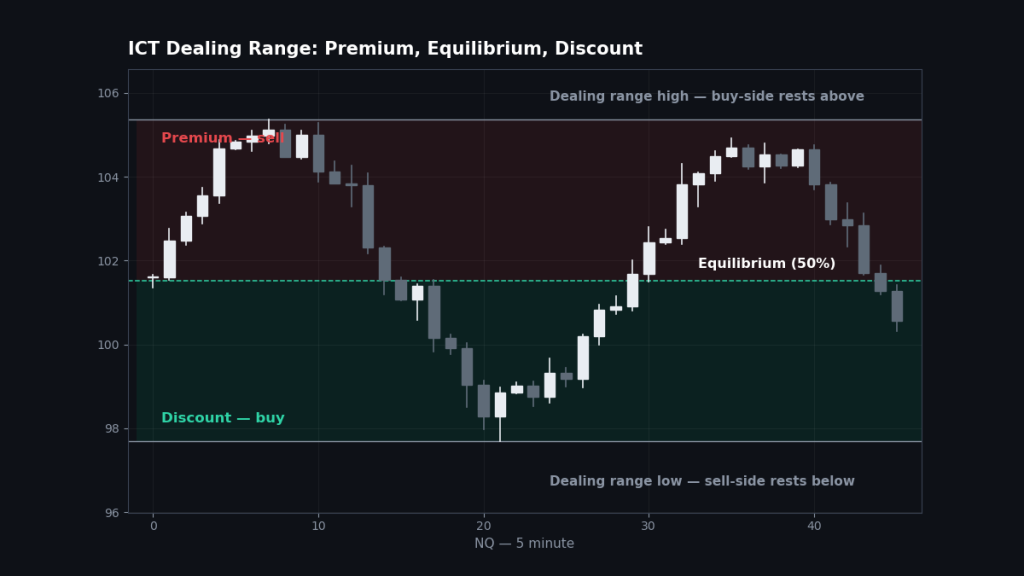
An ICT dealing range is the span between a significant swing high and a significant swing low that price is currently working inside — the ring the algorithm is delivering price within, with a premium half to sell, a discount half to buy, and equilibrium at 50% in between. IPDA — the Interbank Price Delivery Algorithm — is ICT’s name for the delivery mechanism itself, and for the trader it matters most as a measuring habit: IPDA works off standard lookback ranges of 20, 40 and 60 trading days, and the highs and lows of those lookbacks are the pools price is ultimately drawn toward. Know your current dealing range and you know where you are; know the IPDA lookbacks and you know the map of where price can go next. This page is the measuring system the rest of the section quietly depends on.
What is a dealing range?
You met the dealing range inside premium and discount, where it did one job: defining the range whose halves graded every entry. Here is the fuller picture. At any moment, on any timeframe, price is trading inside some dealing range — bounded by the last significant swing high above and swing low below. “Significant” is the operative word: not every wiggle qualifies. The boundaries of a dealing range are swings that matter — the highs and lows where liquidity actually rests, where structure actually turned. On NQ, the working dealing ranges a futures trader lives inside are nested like boxes:
- The daily range — yesterday’s high to yesterday’s low (a new futures day starts at the 5:00 p.m. ET open), framing today’s bias and location.
- The session range — the overnight range from the evening open into the New York morning, the ring the cash session most often works against.
- The current leg — the most recent impulsive swing on your execution timeframe, whose premium and discount grade the entry forming right now.
The discipline from Week 1 stands and deserves repeating: always know which range am I in, and where in it is price? Premium and discount are meaningless without a named range, and most “the concept failed” stories are really “I measured the wrong range” stories. When ranges disagree — price in discount of the daily range but premium of the current 15-minute leg — the higher-timeframe range governs the bias and the lower one governs the timing. That hierarchy is the whole art.
What is IPDA?
IPDA stands for the Interbank Price Delivery Algorithm — ICT’s term for the system he believes delivers price: not a free-for-all of buyers and sellers, but an algorithm cycling price through repeated states — expansion, retracement, reversal, consolidation — and running it between liquidity and fair value on a schedule set by time. You do not need to take a position on the metaphysics to use IPDA, because for the working trader IPDA cashes out as something concrete: standard lookback ranges.
The idea is simple. When the algorithm delivers price toward a draw, it references recent history in fixed windows — the last 20 trading days, the last 40, the last 60. The extremes of those windows are not trivia; they are standing orders’ worth of liquidity and unfinished business. An old high inside the 20-day lookback is a near-term objective. A low that has survived 60 days is a major pool — the kind of level a whole month’s delivery can be organised around. ICT calls these the IPDA data ranges, and the habit of measuring them is what turns “price might go up or down” into a map with named destinations.
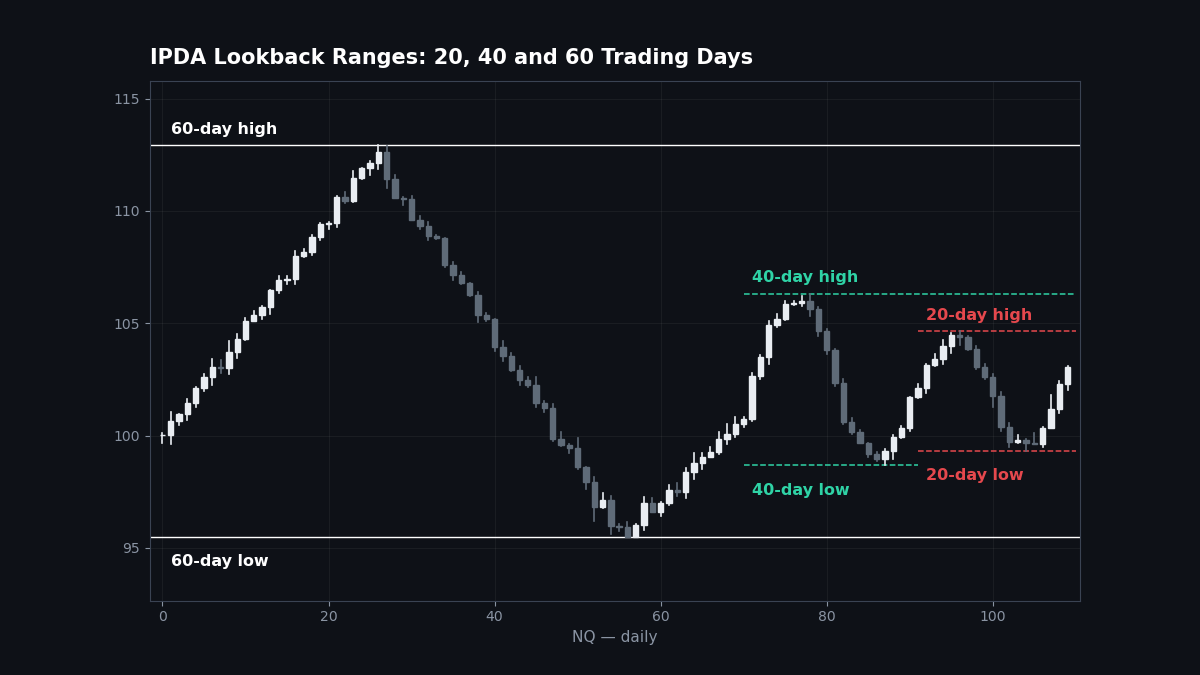
The IPDA lookbacks: 20, 40 and 60 days
Mark these on a daily chart. That is the entire setup — three windows, six levels.
| Lookback | What to mark | What it is used for |
|---|---|---|
| 20 trading days | Highest high and lowest low of the last 20 days | The near-term data range: the pools this month’s delivery is working between |
| 40 trading days | Highest high and lowest low of the last 40 days | The intermediate range: objectives when the 20-day extremes are taken |
| 60 trading days | Highest high and lowest low of the last 60 days | The major range: quarter-scale pools that organise the largest moves |
How the ranges work together in practice:
- Price lives inside the 20-day range most of the time. The current dealing ranges — weekly, daily, session — nest inside it. While price works between the 20-day high and low, those extremes are the outer walls and the standing draws.
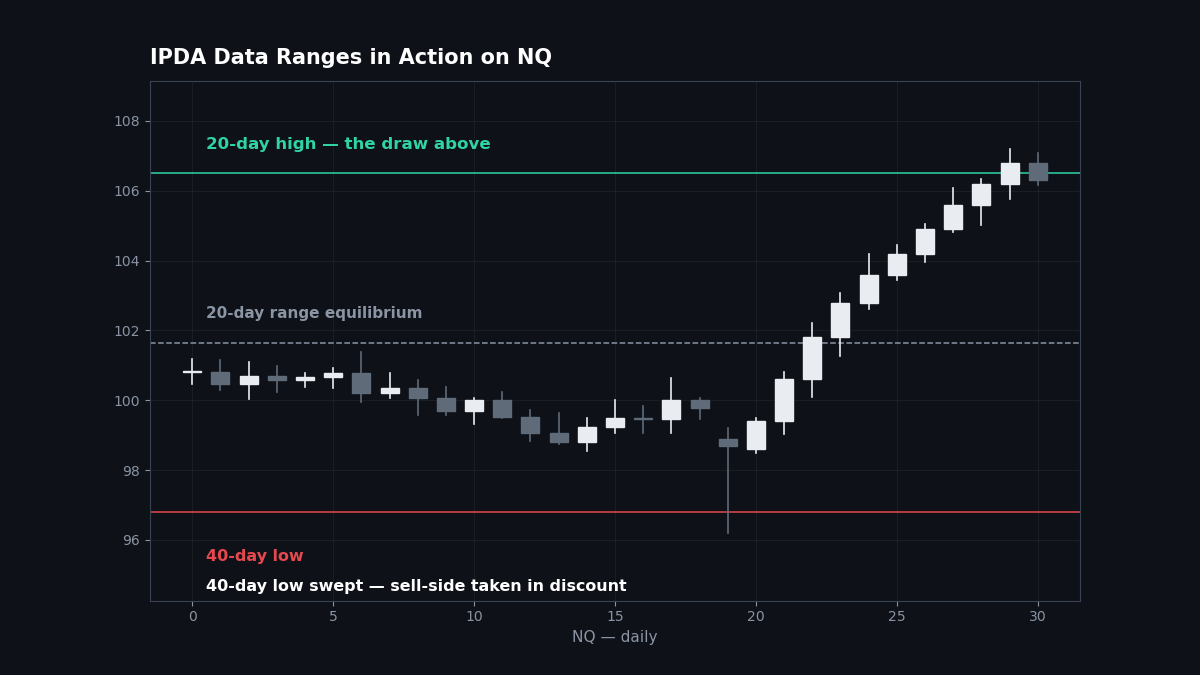
- Taking a lookback extreme is an event. When price sweeps the 20-day high, it has raided the biggest visible buy-side pool of the month — read it with the liquidity guide: reversal risk is real, but so is expansion toward the 40-day extremes if structure breaks and holds.
- Ranges update as days roll. Each new session, the window slides: an old extreme can drop out of the 20-day lookback, quietly redrawing the map. Refresh the levels weekly — a stale data range is just a rumour about last month.
- Draws are chosen from the map, not invented. When you ask “what is price drawn to?” the honest answer is always one of the named pools: the current range’s extremes first, then the lookback extremes beyond them, prioritised by which side of equilibrium price sits on and what structure says.
How do you trade with dealing ranges and IPDA on NQ?
Neither tool is an entry. Together they are the top-down frame every entry in this section hangs inside. The working routine:
- On the weekend or before the week, mark the 20/40/60-day highs and lows on the daily chart. Note which lookback extreme is nearest above and below, and whether price sits in premium or discount of the 20-day range as a whole.
- Each morning, frame the day: yesterday’s range and the overnight range inside it. Name the day’s likely draws — the pools inside today’s dealing range first, and any lookback extreme close enough to be in play.
- Trade only when the frames agree. The highest-quality NQ mornings line the frames up: daily structure bullish, price in discount of the daily range, sell-side swept at the open, and a draw toward buy-side — ideally a lookback high — above. Then the entry tools from Week 2 — the fair value gap, the order block — are just how you get aboard a move the ranges already described.
- Use lookback extremes as final targets and as warnings. A long whose objective is the 20-day high should plan its last partial there, not beyond it. And a move that has just swept a 60-day extreme has raided a quarter’s worth of stops — reversal setups at those levels deserve more respect, and continuation trades beyond them deserve less size.
A worked frame: NQ has spent two weeks inside a daily range in the lower half of its 20-day lookback — discount of the data range. Monday’s session sweeps a low that has held for 40 days — intermediate sell-side taken — and shifts structure up with displacement. The ranges wrote the trade before the entry tool appeared: major pool raided, discount location, draw now to the 20-day high overhead. The market structure shift and the gap were just the trigger.
This framing is also where our section shakes hands with the rest of what we trade here. A Goldbach level resting within a few points of a 20-day lookback high is not two ideas — it is one price the algorithm has two reasons to visit, and the same goes for a quarterly level sitting at a dealing range extreme. Different vocabularies, same institutional map: price targets are data ranges, and data ranges are where the orders are.
Common mistakes
- Measuring premium and discount from an unnamed range. “Price is in discount” — of what? If you cannot say which swing high and low bound the range, the classification is fiction. Name the range out loud before you use its halves.
- Letting the small range overrule the big one. Premium of the 15-minute leg inside deep discount of the 20-day range is a timing detail, not a reason to short the day. Higher timeframe ranges govern; lower ones schedule.
- Drawing lookback extremes once and never refreshing them. The 20/40/60 windows slide every session. The high that drops out of the 20-day lookback this week is no longer this month’s standing draw. Refresh weekly or trade on an expired map.
- Treating a lookback extreme as guaranteed resistance or support. A 40-day high is a pool, and pools get taken — the level’s meaning is the raid and what structure does after it, not a wall price must respect. Fade a lookback extreme blind and you will eventually fund its sweep.
- Using IPDA windows on the wrong clock. The lookbacks are counted in trading days on the daily timeframe — sessions that roll at the 5:00 p.m. ET futures open, not calendar days and not midnight bars. Count them on a properly rolled daily chart or the six levels you mark are quietly wrong.
FAQ
What is an ICT dealing range?
The span between a significant swing high and swing low that price is currently trading inside. Its midpoint is equilibrium; the half above is premium, the half below is discount. Every premium/discount judgment is made against a specific, named dealing range.
What does IPDA stand for?
Interbank Price Delivery Algorithm — ICT’s name for the mechanism he believes delivers price between liquidity and fair value. In practice, traders use “IPDA” to mean its standard lookback ranges of 20, 40 and 60 trading days.
What are the IPDA lookback ranges?
Fixed windows of the last 20, 40 and 60 trading days. The highest high and lowest low of each window are marked on a daily chart as data ranges — standing liquidity pools that act as draws, objectives and event levels for delivery.
How do dealing ranges and IPDA fit together?
They are the same idea at different scales. A dealing range is the ring price is working inside right now; the IPDA lookbacks are the largest rings — the month and quarter-scale ranges whose extremes become the objectives the smaller ranges deliver toward.
Which IPDA lookback matters most?
The 20-day range, day to day — price lives inside it and its extremes are the nearest major pools. The 40 and 60-day extremes matter when price reaches them: those raids are the events that reorganise a month’s or a quarter’s delivery.
How often should you redraw IPDA levels?
Weekly is enough for most futures traders, with a check whenever a new 20-day high or low prints. The windows slide daily, so the habit that matters is refreshing them on a schedule instead of marking them once and forgetting.
Where to go next
The dealing range earns its keep inside premium and discount — the Week 1 page this one completes. The pools at the lookback extremes are read with the liquidity guide, and the entries inside the ranges are the fair value gap and the order block. The full map is in the ICT section hub.