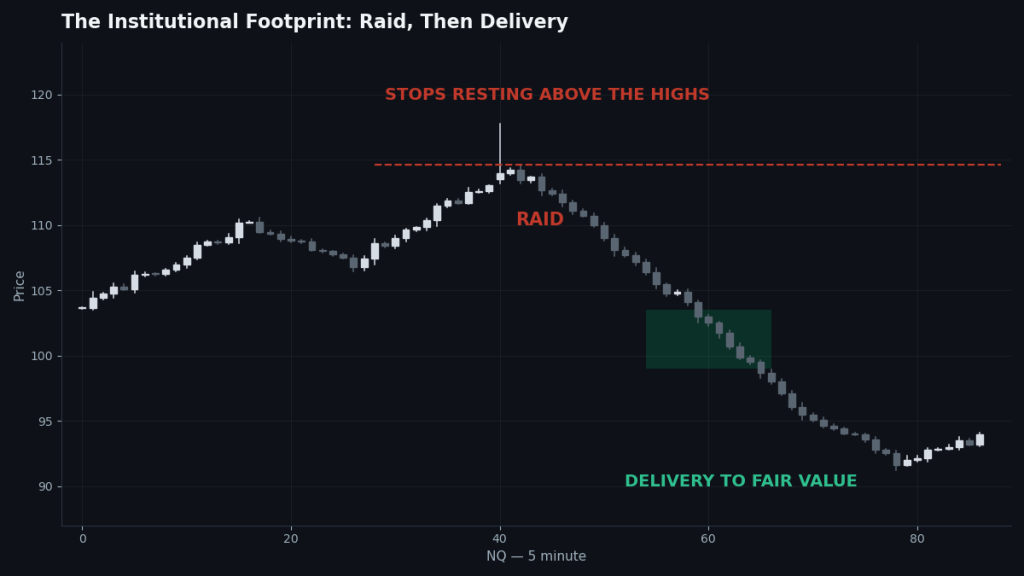
ICT trading is a price-action methodology created by Michael J. Huddleston, who trades and teaches under the name Inner Circle Trader (ICT). It explains price movement through three ideas: markets are delivered by an algorithm between pools of liquidity, price seeks fair value after moving inefficiently, and every range has a premium half and a discount half where institutions prefer to sell and buy. Instead of indicators or chart patterns, ICT traders read market structure, mark where stop orders are resting, and wait for price to come to them at specific times of day. That is the whole method — everything else is vocabulary built on those three ideas.
What is ICT trading, exactly?
Strip away the terminology and ICT is a theory of why price moves, with a practical method attached. The theory: price on modern electronic markets is delivered by pricing algorithms whose job is to move price between states of liquidity (where orders are) and fair value (where trading actually balances). The method: identify the current market structure, mark the liquidity above and below, note whether price sits in premium or discount, and only act when price raids a pool and shifts — usually inside a defined time window.
Two consequences follow, and both matter for futures traders. First, moves that look like breakouts are often the opposite: a push above an old high exists to trigger the stops resting there, and the real move frequently starts once those orders are filled. Second, timing is a first-class variable. The same level at 9:45 a.m. ET and at 1:15 p.m. ET is not the same trade, because the algorithm does its business in sessions and killzones, not evenly across the day.
ICT is not a single strategy. It is a framework that contains strategies — the 2022 Model, the Silver Bullet, Turtle Soup, and others — each of which is just the framework narrowed to a repeatable sequence.
Where did ICT come from?
Huddleston taught publicly for years, first on forums and then through a long-running YouTube series, including a free 2022 mentorship that became the standard entry point. His material borrows from older institutional trading ideas — market maker models, Wyckoff-style accumulation and distribution, opening range theory — and reorganises them into one vocabulary. You do not need to agree with every claim about why it works to use the framework; thousands of futures traders use the concepts simply because structure, liquidity, and premium/discount describe NQ price action well.
That said, be clear-eyed: ICT is a lens, not a law. Price does seek liquidity and does rebalance inefficiencies — you can watch it happen every morning on NQ — but no framework removes risk, and the traders who last are the ones who treat the concepts as probabilities and manage size accordingly.
The three ideas underneath everything
1. Price is delivered between liquidity and fair value
Above every obvious high sits a cluster of buy stops; below every obvious low, sell stops. Those clusters are liquidity pools, and delivering price into them is how large orders get filled. Between pools, price often moves fast and leaves a fair value gap — a thin stretch where only one side traded. The algorithm tends to revisit those gaps. If you know where the pools and the gaps are, you have a working map of where price is likely to go and where it is likely to react.
2. Every range has a premium half and a discount half
Draw any meaningful high-to-low range and mark the 50% level — equilibrium. Above equilibrium the market is in premium relative to that range; below it, discount. Institutions sell premium and buy discount. A long list of ICT entry rules is just this idea with better manners: do not buy in premium, do not sell in discount, and when in doubt, wait for equilibrium to tell you which side of the range you are actually on.
3. Structure tells you the story so far
Swing highs and lows, and the breaks between them, tell you whether buyers or sellers are currently delivering price. A break of structure (BOS) says the trend continues; a change of character (CHoCH) is the first warning it may be ending; a market structure shift (MSS) after a liquidity raid is the classic reversal trigger the models are built on. Structure is the grammar — the other concepts are words.
How do you identify an ICT setup?
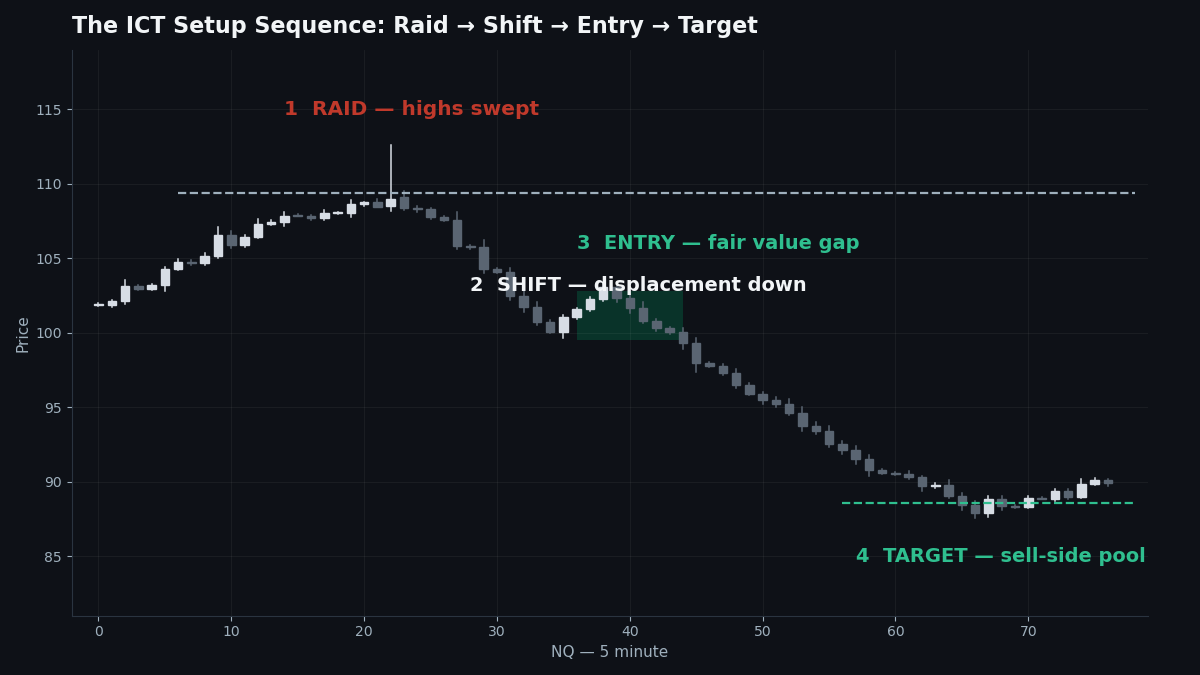
A tradeable ICT sequence on NQ usually contains most of these steps, in this order:
- Frame the day. Mark yesterday’s high and low, the overnight range, and any equal highs or lows. Decide the likely draw: which pool is price reaching for?
- Wait for the window. The New York AM killzone (about 8:30–11:00 a.m. ET) is where the main sequence usually runs.
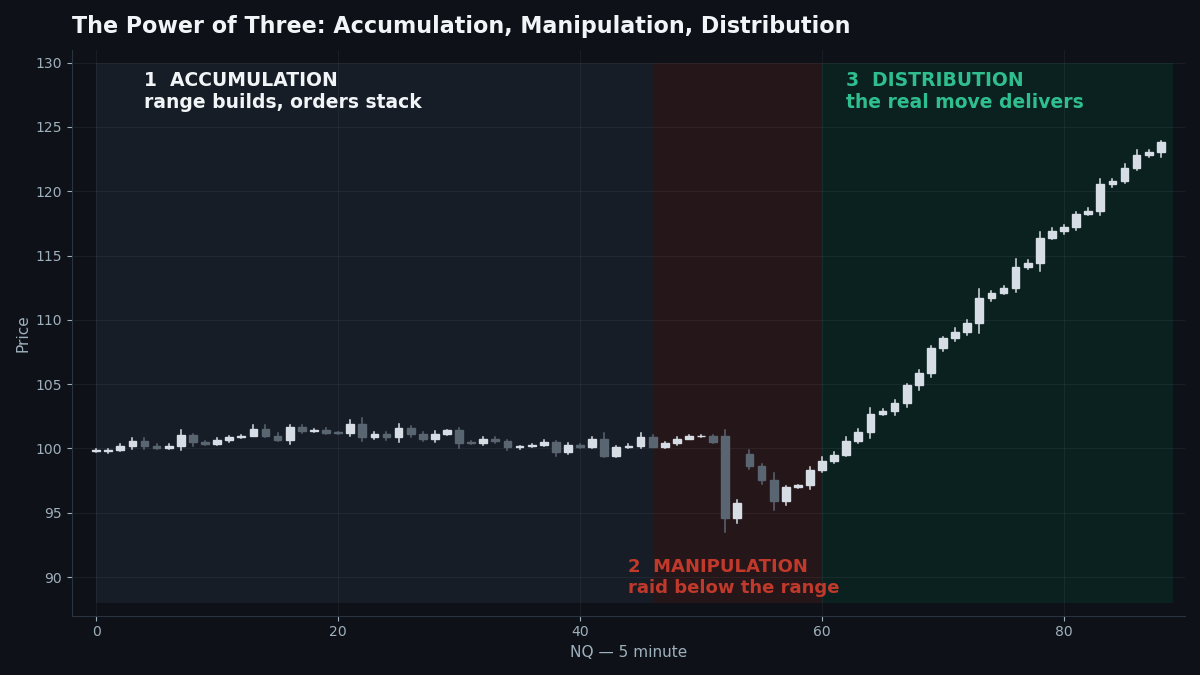
- Watch for the raid. Price sweeps a pool — pokes above the old high or below the old low — and fails to continue.
- Confirm the shift. Structure breaks the other way with displacement: a strong, wide-range move that leaves a fair value gap behind it.
- Enter on the return. Price retraces into the gap or the block left by the displacement, on the correct side of equilibrium for your direction.
- Target the opposite pool. The draw you identified in step 1 is the objective; the raid that started everything is your invalidation reference.
If several steps are missing, you do not have an ICT setup — you have a hope with ICT vocabulary pasted on it.
How do futures traders actually use it?
On NQ, the daily routine is unglamorous and repeatable. The futures day opens at 5:00 p.m. ET; the overnight session builds a range and usually a bias. London (2:00–5:00 a.m. ET) often makes the first pool or takes the first one. New York is the main event: the 8:30 a.m. data releases and the 9:30 cash open deliver the day’s real displacement, frequently after a Judas-style raid of the overnight or London extremes. Traders following the framework either trade the raid-and-shift sequence in the morning or they do nothing — and treating “nothing” as a valid position is half the method.
It also pairs well with level-based frameworks. Here, ICT dealing ranges sit on the same charts as our Goldbach levels and quarterly levels; a liquidity pool resting at a major level, inside a killzone, after a structural shift, is about as much confluence as an NQ chart offers.
Common mistakes
- Learning the entries before the framework. Order blocks and fair value gaps are the last 10% of the method. Structure, liquidity, and premium/discount are the first 90%.
- Assuming every sweep reverses. Sometimes price takes a pool and keeps going — that is continuation, and structure will tell you. The sweep is information, not a signal by itself.
- Trading all day. ICT is built around windows. Forcing the framework at lunch or in the afternoon chop manufactures losses the method never asked for.
- Treating YouTube vocabulary as a system. Naming a candle pattern “ICT” does not make it a setup. If there is no draw on liquidity and no shift, there is no trade.
- Risking like the framework is certain. It is a probability framework. The traders who blow up on ICT concepts usually had the right idea and five times the right size.
FAQ
What is ICT trading in simple terms?
A way of reading charts that says price moves between pools of stop orders (liquidity) and areas of fair value, inside a structure you can map. Traders use it to anticipate where price is drawn to instead of reacting to indicators.
Who created ICT trading?
Michael J. Huddleston, the Inner Circle Trader. His public mentorships — especially the 2022 series — are where most traders learn the framework.
Is ICT the same as Smart Money Concepts (SMC)?
They overlap heavily. SMC is the broader label many traders use for institutional-style concepts; ICT is Huddleston’s specific framework and vocabulary. In practice the core ideas — structure, liquidity, fair value — are shared.
Can ICT be used on NQ futures?
Yes, and it suits index futures well: one central price feed, clean sessions, and liquidity pools that form around obvious levels like the prior day’s high and low.
What is the best ICT model for a beginner?
The 2022 Model, because it forces you to learn the full sequence — liquidity raid, market structure shift, fair value entry — instead of cherry-picking single concepts.
Does ICT trading actually work?
The concepts describe real, observable behaviour: stops do cluster at obvious levels, and price does revisit inefficiencies. Whether it works for you depends on execution, timing, and risk — like every other serious framework.
Where to go next
This page is the premise; the skills start in the ICT section hub. Learn the first real concept in ICT market structure, then see what price is reaching for in ICT liquidity.