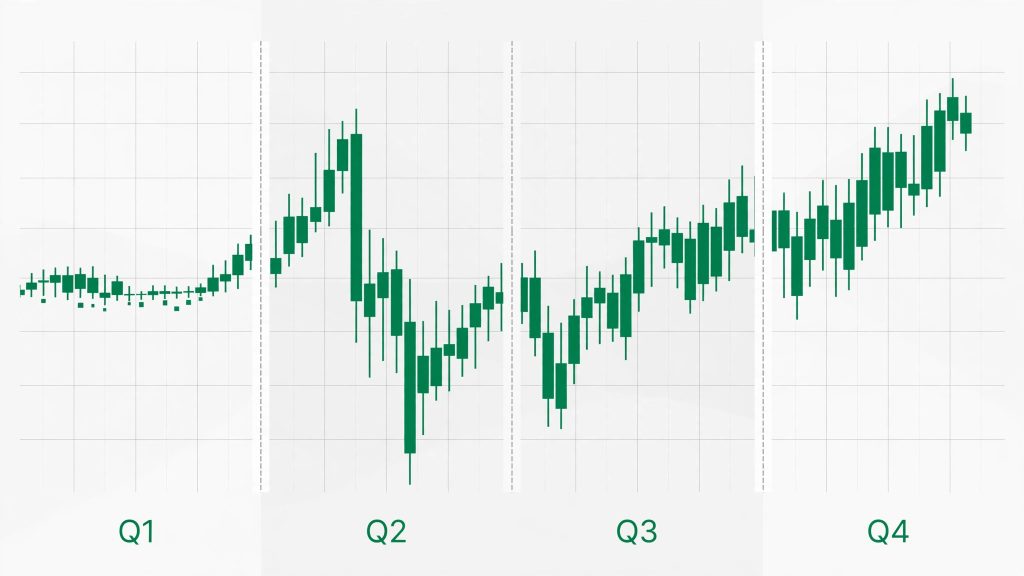
How to use this: start with the cheat sheet, learn the foundation, then pick one model and backtest it.

Cheat Sheet
Cycle → Timeframe
| Cycle | View it on |
|---|---|
| Quadrennial (4yr) | Monthly chart |
| Yearly | Weekly chart |
| Quarterly | Daily chart |
| Monthly | 4-hour chart |
| Weekly | 1-hour chart |
| Daily | 15-minute chart |
| 90-minute | 5-minute chart |
| Micro | 1-minute chart |
Quarter functions
- Q1 = Continuation — extends the prior cycle’s direction
- Q2 = Accumulation — tight range, builds energy
- Q3 = Manipulation — stop-hunt, fake move
- Q4 = Distribution — the real move
Daily sessions (ET)
- Asia: 6:00 PM – 12:00 AM · London: 12:00 AM – 6:00 AM
- New York AM: 6:00 AM – 12:00 PM · New York PM: 12:00 PM – ~4:30 PM
90-minute quarters divide each block into Q1–Q4; micro = 90 ÷ 4 = 22.5 minutes.
The trade sequence
- Daily bias — decide direction first
- Wait for 9:00–10:30 AM ET — the primary window
- Sequential SMT across NQ/ES/YM
- Enter at tCISD — candle close beyond the SMT candle’s open; stop on the SSMT extreme
- Target — opposing liquidity (prior highs/lows, true opens)
Key rules
- SSMT must form between two consecutive quarters (never skip one)
- Bullish SSMT signals belong below the true open; bearish above it
- Enter within 5–7 candles of the SSMT — later = weaker
- One clean cycle = one SSMT then distribution. Multiple back-to-back SSMTs = stand aside
- Don’t trade if price disrespects the tCISD level more than twice
- Align with higher-timeframe order flow — bearish PDAs don’t hold in bullish flow
1. Quarters & Time Cycles
Every timeframe’s candle divides into 4 quarters (Q1–Q4), each with a function. Price moves through accumulation → manipulation → distribution at every scale — it’s fractal.
The cycles
- Quadrennial (4 years): monthly chart; each year = one quarter. Election years mark transitions.
- Yearly: Jan–Mar Q1, Apr–Jun Q2, Jul–Sep Q3, Oct–Dec Q4.
- Monthly: each week = one quarter. Week 1 sets the monthly wick; weeks 2–3 build the body.
- Weekly: Mon Q1, Tue Q2, Wed Q3, Thu Q4. Friday sits outside the quarters — usually pulls back into the weekly range or toward the true week open.
- Daily: 15m chart; four six-hour sessions.
- 90-minute: the day-trading workhorse, on 5m.
- Micro: 22.5-minute segments for precision entries.
Reading the cycle
- Look at what the previous quarter did: accumulation in Q1 → expect manipulation in Q2/Q3.
- If Q3/Q4 already tagged a higher-timeframe key level → expect reversal; if not → expect continuation toward it.
- Wednesday is the classic weekly manipulation day; Thursday distributes.
- After price tags a key level, Q4 may accumulate instead of reversing cleanly — be cautious with Q4 reversals.
2. True Opens
A true open is a cycle’s opening price — the line in the sand for that timeframe. Price returning to it is returning to fair value.
- True Day Open (TDO): midnight ET. Above it leans bearish, below it leans bullish (intraday).
- True Week Open (TWO): Monday 6:00 PM ET. Weekly bias line.
- True Month Open (TMO): first-of-month open. Monthly bias line.
Stacked true opens (day + week opens at nearly the same price) = highest-probability reaction zone. Price displaced far from the true open tends to return to it within the cycle.
3. SMT & Sequential SMT
SMT — basic divergence
Compare correlated assets (NQ / ES / YM). Divergence = one takes out a high/low while the other fails to. Bullish SMT: ES takes the low, NQ holds a higher low → strength, expect up. Bearish SMT: one makes a higher high, the other fails → distribution, expect down. SMT often prints before the move.
Triads: use three correlated assets to avoid false signals. They don’t need to print extremes simultaneously.
Sequential SMT (SSMT)
- Mark the absolute high/low of the previous quarter.
- In the current quarter, watch whether price takes it out.
- Divergence: one asset breaks the prior quarter’s extreme; the correlated asset fails → SSMT.
REAL vs FAKE: real = clean break by one, clear failure by the other, sensible location. If you have to squint, it’s fake. HSSMT (Hidden): the divergence shows in quarter candle bodies, not wicks — quieter, same logic.
4. tCISD — The Entry
tCISD = True Change in the State of Delivery. The precise trigger after an SSMT — earlier and better-priced than waiting for a full market-structure shift.
- Identify the first candle that created the SSMT (the liquidity-taking candle).
- Wait for a candle to close beyond that candle’s open (above for bullish, below for bearish).
- That close = tCISD confirmed. Enter the retest.
| Cycle | Read tCISD on |
|---|---|
| Quarterly | Daily chart |
| Monthly | 4-hour chart |
| Weekly | 1-hour chart |
| Daily | 15-minute chart |
Same timeframe as the SSMT cycle — never drop down or go up.
Bullish: need a bullish SSMT that closes bearish, then a close back above its open. Bearish: mark the most recent bullish candle’s open; wait for close below it. Invalidation: two disrespects of the tCISD level = dead setup. iTCISD is the mirror entry when the first tCISD fails and flips.
5. PSP — Precision Swing Points
A 3-candle swing high/low confirmed by correlated-asset divergence: candle 2 has the extreme vs. candles 1 and 3, and NQ/ES close differently at the same time (e.g. NQ bullish, ES bearish).
- Entry: open of candle 3 (after candle 2 confirms).
- Stop: PSP high (bearish) / low (bullish).
- Target: back into candle 2’s wick/body, or next liquidity.
- Timing: within 5–7 candles of the SSMT.
- Direction: trade the weaker asset’s direction — the one printing the bearish close won’t exceed the PSP high.
PSPs confirm SSMTs and can also trade standalone for bias. If only one asset forms the swing shape (other just closes differently), that’s a PSC (Precision Candle) — still valid.
6. SMT-Fill
After an SSMT, price leaves gaps. Watch how correlated assets treat their gaps — divergence in fill behavior is the signal:
- One asset trades back into its gap, the other doesn’t → the refuser is stronger.
- One trades below 50% of its gap, the other holds above → the holder is stronger.
- One fills completely, the other doesn’t → the unfiller is stronger.
An SMT-Fill alone can be the entry (ICT-style), or stack it: HTF gap sets direction, LTF tCISD times the entry. If the gap entry fails and the SSMT level breaks, the SSMT is failing — exit.
7. Timing — Killzones, DOL & Daily Bias
Killzone: trade the quarter transitions. The prime day-trade window is 9:00–10:30 AM ET. Outside it, expect chop.
DOL (Draw on Liquidity): before every trade, name where price wants to go — untapped highs/lows, true opens, equal highs/lows. Bias + DOL = the trade. Bullish bias with the DOL below = wait.
Daily bias in 4 steps: (1) higher-timeframe direction, (2) price position vs. true opens and quarter, (3) SSMT direction = bias until invalidated, (4) bias + DOL + killzone = trade; any one missing = wait.
8. Advanced Concepts
- DFR (Defining Range): Q1’s range (minus its first third, which is noise) = the cycle’s dynamic S/R. Q1’s open breaking hints at the cycle extreme.
- Stacked True Opens: day + week opens clustered = highest-probability reaction zone. Don’t trade through blindly.
- True Orderblock: only OBs at quarterly extremes or SSMT points count. Random mid-range OBs get run over.
- Trading SSMT invalidation: when SSMT fails (level taken out instead of respected), flip bias — the stops are fueled, trade the continuation.
- Priority gaps: FVGs at quarter boundaries or after SSMTs get priority; mid-quarter gaps with no narrative get filled and forgotten.
9. The Models
Model 1 — 90M tCISD (“Freedom Model”)
- Bias from higher timeframe (15m/1H).
- Wait for 9:00–10:30 AM ET.
- Sequential SMT on the 90-min cycle (5m chart).
- tCISD close → enter the retest. Stop beyond the SSMT extreme.
- Target opposing liquidity (prior 90M high/low, true day open).
Model 2 — QT in 3 Steps
- Identify your quarter and its function.
- Wait for the manipulation (Q3 stop-hunt).
- Trade the distribution (Q4) toward the DOL.
Model 3 — 2-Stage Sequential SSMT
Wait for two SSMTs in sequence (e.g. daily-cycle SSMT + 90M SSMT same direction). Fewer trades, higher win rate — the second confirms the first was real.
Model 4 — SSMT + SMT-Fill
SSMT sets direction → gaps form → wait for fill divergence → enter with the stronger asset, stop beyond the gap extreme.
Model 5 — Swing Trade Model
Weekly cycle on 1H: Mon Q1 → Thu Q4. Position for Thursday’s distribution using Wednesday’s manipulation as entry. Same concepts, slower.
10. Indicator Notes
Design rule: minimal. If it clutters the chart, it doesn’t ship.
Earns a place: 90-min quarter grid (subtle verticals) · true-open rays (thin, quiet) · SSMT markers (one dot/triangle + direction — instantly visible) · tCISD level (short marker, removed on invalidation) · killzone shading (barely-there, 9:00–10:30 AM ET).
Off by default: micro grid, PSP markers, SMT-Fill zones, DFR box, multi-cycle labels.
Alert candidates: SSMT printed · price entering killzone · tCISD triggered.
Glossary
- SSMT (Sequential SMT)
- Divergence between correlated assets across two consecutive quarters — one breaks the prior quarter’s extreme, the other fails. The core signal.
- SMT
- Basic intermarket divergence (one asset takes a high/low, the other doesn’t). SSMT is SMT with quarterly structure.
- tCISD
- True Change in the State of Delivery — the candle close beyond the SMT candle’s open confirming delivery flipped. The entry trigger.
- iTCISD
- Inverse tCISD — mirror entry when the first tCISD fails.
- PSP
- Precision Swing Point — 3-candle swing confirmed by correlated assets closing differently simultaneously.
- PSC
- Precision Candle — only one asset forms the swing shape; the other just closes differently. Still informative.
- SMT-Fill
- Gap-behavior divergence after SSMT — one asset fills its gap, the other refuses.
- HSSMT
- Hidden SSMT — divergence in quarter candle bodies, not wicks.
- DFR
- Defining Range — Q1’s range (minus first third) as the cycle’s S/R framework.
- DOL
- Draw on Liquidity — where price most likely heads (untapped highs/lows, opens, equal highs/lows).
- True Open
- A cycle’s opening price (day/week/month/session). Bias reference.
- Killzone
- High-probability trading window (9:00–10:30 AM ET for day trades).
- AMDX
- Quarter labeling: Accumulation, Manipulation, Distribution, eXtension (continuation).
- Triad
- Three correlated assets (e.g. NQ/ES/YM) analyzed together to avoid false signals.
Want to Learn NQ Futures From Zero?
If Quarterly Theory opened your eyes to how time drives price, my free beginner’s NQ email course will take you from complete newcomer to understanding exactly how I trade NQ futures every morning.
Educational content only — not financial advice.