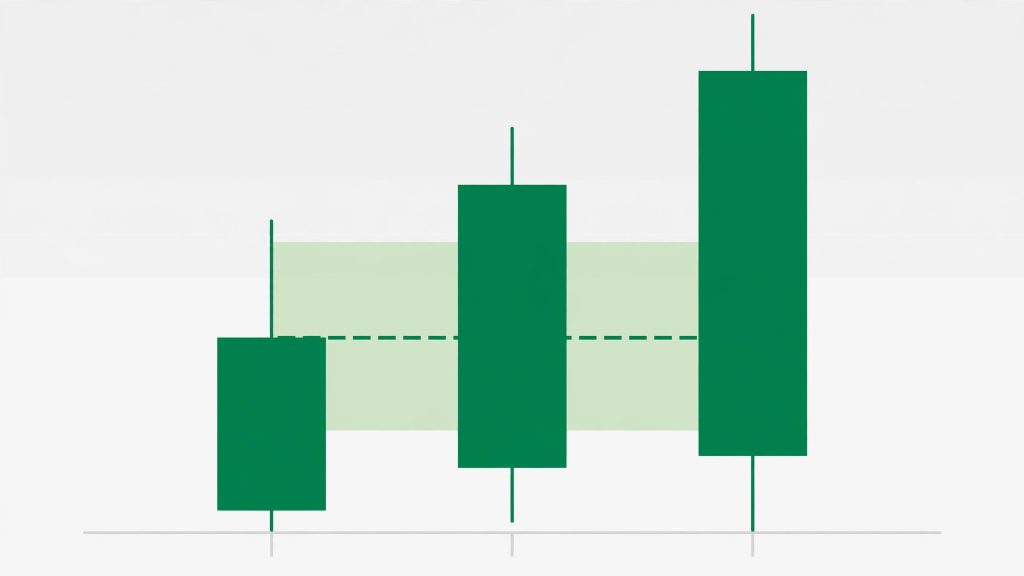
A fair value gap (FVG) is a small price gap left inside a fast move, where price traveled so quickly that it only traded on one side of the market. You spot it across three candles: the high of the first candle and the low of the third candle don’t overlap, and the space between them is the gap. Traders watch these gaps because price often comes back to fill them before continuing — and that return trip is where the trade is.
That’s the whole concept. Everything else in this post is how to find them, which ones matter, and which ones to ignore.
What a Fair Value Gap Actually Is
Forget the jargon for a second. A fair market is one where buyers and sellers both got to trade. When price moves in a normal, two-sided way, every level gets “fair” trading — offers lifted, bids hit, business done on both sides.
A fair value gap is what happens when that doesn’t occur. Price moves so aggressively in one direction that a stretch of prices gets skipped over. Only one side traded there. The market delivered price inefficiently, and that inefficiency is visible on your chart as a literal gap between candle wicks.
There are two kinds:
- Bullish FVG: price rips upward. The low of candle 3 is above the high of candle 1. The gap sits below current price, and it acts as a zone price may return down into.
- Bearish FVG: price dumps downward. The high of candle 3 is below the low of candle 1. The gap sits above current price, and price may return up into it.
The middle candle is the important one. Its body is the fast move — what traders call displacement. The gap is simply the part of that move where candles 1 and 3 failed to overlap.
A Worked Example on NQ
Say NQ is trading around 25,000 and a bullish move kicks off on the 5-minute chart:
- Candle 1 trades up to a high of 25,010, then closes.
- Candle 2 is the displacement candle — it drives straight up to 25,045.
- Candle 3 opens and its lowest print is 25,032.
Candle 1’s high (25,010) and candle 3’s low (25,032) never met. The fair value gap is the 22 points between them: 25,010 to 25,032.
Now the money math, because this is where beginners get hurt. On NQ, every point is $20 per contract. A 22-point gap is $440 of movement per contract. On MNQ it’s $2 per point — the same 22 points is $44. Same chart, same gap, one-tenth the risk. If you’re learning to trade these, you belong on MNQ until the pattern is boring to you.
Why Price Comes Back to the Gap
The standard explanation is that the market “owes” that price range a fair, two-sided trade. Institutions that moved price through the gap left business unfinished there, and when price returns, that unfinished business gets completed.
You don’t need to believe any particular story about algorithms to use this. Just watch what actually happens on NQ: after a hard displacement move, price very commonly retraces into the gap it just left — often to the gap’s midpoint — before deciding whether to continue. That midpoint has a name, too: consequent encroachment, the 50% level of the gap. Many traders treat a tap of the midpoint as the gap being “filled enough,” even if price never covers the full range.
Two things follow from this:
- An unfilled gap in the direction of your trade is a target and an entry zone at the same time. If you’re bullish and there’s a fresh bullish FVG below price, the return into that gap is where longs get offered a second chance.
- A gap is not magic. Price blows straight through gaps every day. Context decides whether a gap matters — and context, in my trading, always starts with time, not the pattern. More on that below.
How to Spot an FVG in 10 Seconds
- Look for a big, fast candle — a body that clearly dwarfs the candles around it. No displacement, no gap worth trading.
- Check the candle before it and the candle after it. Do their wicks overlap?
- If the wick of the first and the wick of the third leave open space between them, mark that space as a box. That’s your FVG.
- Note the midpoint of the box. That’s your consequent encroachment line — the level where the gap is half filled.
That’s it. You can do this with a rectangle tool on any charting platform in seconds. No indicator required — and in my model there are no indicators at all. Price and time only.
Bullish vs. Bearish: Reading the Gap’s Job
A gap’s job depends on where it sits relative to price:
- A bullish FVG below price is potential support. If price retraces into it and holds, the up-move is still alive.
- A bearish FVG above price is potential resistance. Same logic, flipped.
- When price closes through a gap and holds on the other side, the gap flips meaning. A bullish FVG that price slices through and then retests from below has become resistance — traders call that an inversion fair value gap (IFVG). In my own trading, the inversion is often the more honest signal: the market told you the original gap failed, and the failure itself becomes the setup.
How I Use FVGs in the 7AM Model
My model is called the 7AM Model because the work starts with time: the 7:00–9:00 AM ET premarket window, where I mark up the morning’s liquidity — where stops are sitting, where price is likely to reach, and when. The FVG fits inside that framework as an entry refinement, never as the reason for the trade.
The order of operations matters:
- Time and liquidity first. Is it my window? Has price taken out a pool of stops — a prior high, a prior low, equal highs or lows? (If you haven’t read it yet, start with what a liquidity sweep is — the sweep is what usually comes before the FVG I care about.)
- Then displacement. After the sweep, does price displace hard the other way, leaving an FVG? That displacement is the market showing its hand.
- Then the entry. Price retraces into the FVG — ideally to its midpoint — and that’s the entry zone, with the stop beyond the gap.
Notice what the FVG is not doing: it’s not generating the trade idea. A random FVG at 2:47 PM with no sweep in front of it and no time window behind it is just three candles. The same FVG inside my morning window, right after a sweep of premarket lows, is a completely different animal.
The Mistakes Beginners Make With FVGs
- Trading every gap on the chart. A busy NQ chart has dozens of tiny gaps. If the middle candle wasn’t real displacement, delete the box. Most gaps are noise.
- Ignoring the timeframe. A 1-minute FVG inside a 15-minute downtrend is a countertrend scalp at best. Know which timeframe’s story you’re trading.
- Entering at the gap’s edge with a full position and no plan. Gaps fill partially, fully, and sometimes not at all before running. Decide in advance: are you entering at the near edge, the midpoint, or waiting for a close through? Write it down before the trade, not during.
- Sizing on NQ while learning. Run the numbers from the example above again: a routine 22-point retracement is $440 a contract on NQ and $44 on MNQ. Learn on the contract that lets you survive your own education.
- Treating a filled gap as a failed idea. Price filling a gap is normal behavior — it’s often the entry itself. The idea fails when price closes through the gap and keeps going, not when it touches it.
The Simple Rules I Teach
- No displacement, no FVG. The middle candle must be obviously aggressive.
- Mark the gap and its midpoint. Both. The midpoint is where “filled” usually happens.
- Only trade gaps that appear after liquidity has been taken, inside a time window you actually trade.
- A gap that gets closed through and retested from the other side has inverted — respect the new direction.
- Size on MNQ until your journal says you’ve earned NQ.
If you want the full framework these rules live inside — liquidity, market structure, time windows, and the complete model taught one short lesson at a time — my free 24-day course walks through it in order. And if you’re running these setups on a funded account, check your numbers first with the prop firm calculator so a single gap trade can’t put your drawdown in danger.
Frequently Asked Questions
What is a fair value gap in simple terms?
It’s a small stretch of price that got skipped during a fast move. Across three candles, the first candle’s wick and the third candle’s wick don’t overlap, and the open space between them is the gap. Price often returns to trade through that space later.
Do fair value gaps always get filled?
No. Many do — partially or fully — but price can also run away and leave a gap open for a long time, or slice straight through it. A gap is a zone of interest, not a promise. The midpoint fill (consequent encroachment) is the most common outcome traders plan around.
What is the difference between an FVG and a regular price gap?
A regular gap is a jump between one session’s close and the next session’s open — empty space between two candles on the daily chart. A fair value gap happens inside a single move, between the wicks of candles 1 and 3 of a three-candle sequence, on any timeframe, including intraday.
What timeframe is best for fair value gaps on NQ?
For day trading NQ, the 5-minute and 15-minute charts show the cleanest displacement and the most usable gaps; the 1-minute is for refining entries once the higher-timeframe idea is set. Whatever you choose, the gap only matters if it lines up with your time window and a liquidity event in front of it.