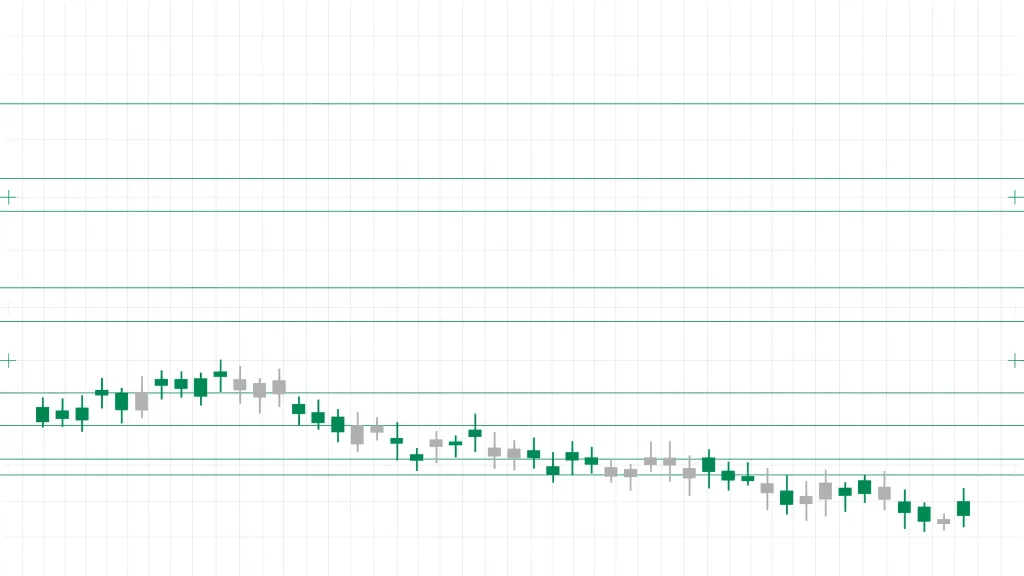
Goldbach levels are a fixed grid of percentage levels drawn inside a price dealing range, where each level is labeled with an ICT concept — order block, fair value gap, liquidity void, and so on. The core claim: ICT price structures form preferentially at specific, mathematically fixed locations. Your order block “works Tuesday but fails Thursday” because Tuesday you were at the right level of the grid and Thursday you weren’t.
The name comes from real mathematics. The level percentages are the Goldbach partitions of 100 — every pair of prime numbers summing to 100: (3,97), (11,89), (17,83), (29,71), (41,59), (47,53). That’s a genuine application of Goldbach’s conjecture from number theory. Whether price actually respects those levels is a separate question, and I’ll be honest about that below.
Where This Comes From
The systematization is by Hopiplaka in the book Demystifying ICT (2023). The underlying concepts — order blocks, fair value gaps, IPDA, AMD — are ICT’s (Michael J. Huddleston). Hopiplaka credits ICT for all terminology and states the mathematical mapping is his own view. Notably, ICT himself reportedly regards any correspondence between the math and his concepts as coincidental.
So: ICT originated the ingredients. Hopiplaka originated the Goldbach grid recipe. The framework is also called IPDA levels or Huddleston levels — IPDA being ICT’s term for the Interbank Price Delivery Algorithm.
The Two Layers of Math
There are two separate pieces of math fused together. Don’t mix them up.
Layer 1: Powers of 3 size the dealing range. A dealing range is always 3^n units — 27, 81, 243, 729, 2187, and so on. This is ICT’s Power of 3, not number theory. You pick the size closest to your average daily range. For NQ futures, where the daily range is typically a few hundred points, 243 is the natural daily dealing range and 81 fits the session/scalp structure.
The range is anchored arithmetically: DR low = floor(current price / PO3) x PO3, DR high = low + PO3. At NQ 24,532 with PO3 243: low = 24,300, high = 24,543.
Layer 2: Goldbach partitions place the levels. The PO3 number says how big the ruler is. The prime-pair percentages say where the marks go. Each concept occupies a zone between partition lines, not the line itself.
The Level Map
Measured from the range high (the grid is symmetric, so it mirrors from the low):
- 0% — HIGH (range high). Just beyond it is Ext, the external range — where stop runs of buy-side liquidity happen.
- 3% — RB, Rejection Block. Zone 0 to 3. PO3-sized wicks here validate the rejection; entry on the next candle.
- 11% — OB, Order Block. Zone 3 to 11. This is where order blocks are supposed to form in this framework.
- 17% — FV, Fair Value. Zone 11 to 17. Fair value gaps and imbalances form here.
- 29% — LV, Liquidity Void. Zone 29 to 41 — the widest gap in the grid at 12%. Long impulsive runs start here. Expect the violent one-directional move.
- 41% — BRK, Breaker. Zone 41 to 47. Breaker blocks form here.
- 47% — MB, Mitigation Block. Zone 47 to 53, straddling equilibrium.
- 50% — EQ, Equilibrium. The premium/discount split. Buy discount, sell premium.
Then the whole thing mirrors from the range low upward.
Notice the spacing: 6% between most levels, 3% at the extremes, with a 12% jump at the LV. That wide gap is deliberate — it maps to how violent liquidity voids actually are.
NQ Worked Example
NQ at 24,532, PO3 243. Range: 24,300–24,543. From the high: RB 24,535.7, OB 24,516.3, FVG 24,501.7, LV 24,472.5, BRK 24,443.4, MB 24,428.8, EQ 24,421.5.
For scalping, drop to PO3 81: range 24,462–24,543, and the OB zone sits about 9 points from each extreme — a realistic NQ scalp reference width.
How It Connects to AMD
If you trade the Power of 3 — accumulation, manipulation, distribution — the Goldbach grid slots in as the price axis while AMD is the time axis. During manipulation, expect stop runs at RB/Ext (the sweep). During distribution, expect expansion through the LV zone toward the opposing OB or FVG.
The highest-conviction trigger in this framework: a manipulation-phase sweep that is simultaneously a PO3-sized stop run (27 points, say) into the daily grid’s LV or OB level. That’s the sweep meeting the grid.
How to Use This as a PO3Trader
The 243-point daily grid becomes your session wireframe. You already mark up premarket 7:00–9:00 ET — liquidity pools, manipulation wicks, imbalances, EQH/EQL. The Goldbach grid adds a second opinion on where inside that range your PD arrays should matter. When your 15-minute order block lines up with the grid’s OB zone (11% from the range extreme), that’s confluence.
The EQ line (50%) slots into your bias framework alongside PDH/PDL, the RTH gap, NWOG, and the Midnight Open. Another premium/discount read: above it you’re paying premium, expect the manipulation leg to target discount.
For the 9:30–9:50 sniper window, drop to the 81-point grid. Its OB zone is about 9 points from the extreme — a realistic width for 1-minute entries inside 15-minute structure. A Judas swing sweeping into the 81-grid’s RB/Ext zone then failing back through is your manipulation signal with a measured target: the opposing OB or FVG zone.
Honest friction: your model is session-anchored (premarket high/low, PDH/PDL); Goldbach is arithmetically anchored (floor(price/243)x243). Two different rulers — don’t let the grid override levels you’ve validated with real screen time. And the 7AM Model is price and time, no indicators: use the grid as a planning tool (premarket markup, bias), not an entry trigger.
Suggested test: run the grid on your NQ chart for two weeks without changing entries. Log whether your sniper setups triggered at Goldbach OB/FVG zones or between zones. If winners cluster at the zones, it earned its screen space. If not, delete it.
The Honest Criticisms
- Not ICT-endorsed. The book’s own prologue disclaims the mapping as the author’s personal view.
- Arbitrary anchoring. Floor(price/PO3) partitions the number line, not market structure.
- Apophenia risk. Fourteen partition lines plus zones — price always appears to respect something.
- No statistical validation. Win-rate claims come with no data or methodology.
- Numerology, not mechanism. Nothing in number theory implies order flow organizes around prime partitions.
- The “PO3 liquidity” escape hatch. Misses get re-labeled as “liquidity left behind” instead of counted against the grid.
Should You Use It?
The framework’s real value is organizational — a fixed, symmetric premium/discount ruler forcing you to predefine where each ICT pattern is allowed to matter. Its weakness is evidential. Run PO3 243 + 81 grids for a few weeks, log touches with the AMD phase, and require the data to show reactions clustering at those zones before committing capital. Confluence layer, not a standalone system.
Frequently Asked Questions
What are Goldbach levels in trading?
A fixed grid of percentage levels inside a PO3-sized dealing range, each labeled with an ICT concept. The percentages come from Goldbach partitions of 100 — prime pairs summing to 100.
Who created Goldbach levels?
Hopiplaka systematized them in Demystifying ICT (2023). The ICT concepts are Michael J. Huddleston’s; the mathematical mapping is Hopiplaka’s own view.
What PO3 size should I use for NQ?
243 points for the daily dealing range, 81 for session/scalp structure.
Do Goldbach levels actually work?
Unproven. The math is real but no mechanism links number theory to order flow. Forward-test before trusting it.
What is the LV level?
The liquidity void zone (29% to 41% of the range) — the widest gap in the grid, where long impulsive runs are expected to launch.